The Challenge
A growing SaaS startup was experiencing rapidly escalating AWS costs, with monthly bills for EC2, S3, and data transfer services totaling $2,904/month. The infrastructure team was spending significant time firefighting capacity issues while costs spiraled out of control. We were brought in to conduct a comprehensive cost optimization audit and implement strategic changes across EC2 compute, S3 storage, and data transfer services. For related strategies, see our cost optimization blog.
EC2 Instance Optimization
EC2 costs were the largest component of the AWS bill, driven by over-provisioned instances, inefficient autoscaling, and suboptimal instance type selection. Through systematic analysis and optimization, we achieved significant cost reductions while maintaining performance and reliability. For autoscaling strategies, see our guides.
- Spot Instances for Stateless WorkloadsIdentified stateless workloads that could tolerate interruptions and migrated them to AWS Spot Instances. This provided up to 90% cost savings on compute resources while maintaining application availability through proper instance distribution and interruption handling.
- Pod Resource Requests/Limits OptimizationAnalyzed actual CPU and memory utilization across all Kubernetes pods using Prometheus metrics and Grafana dashboards. Found that most pods were over-provisioned with requests set 2-3x higher than actual usage. Systematically adjusted requests and limits to match real utilization patterns, which reduced the number of required nodes in the cluster by 35%.
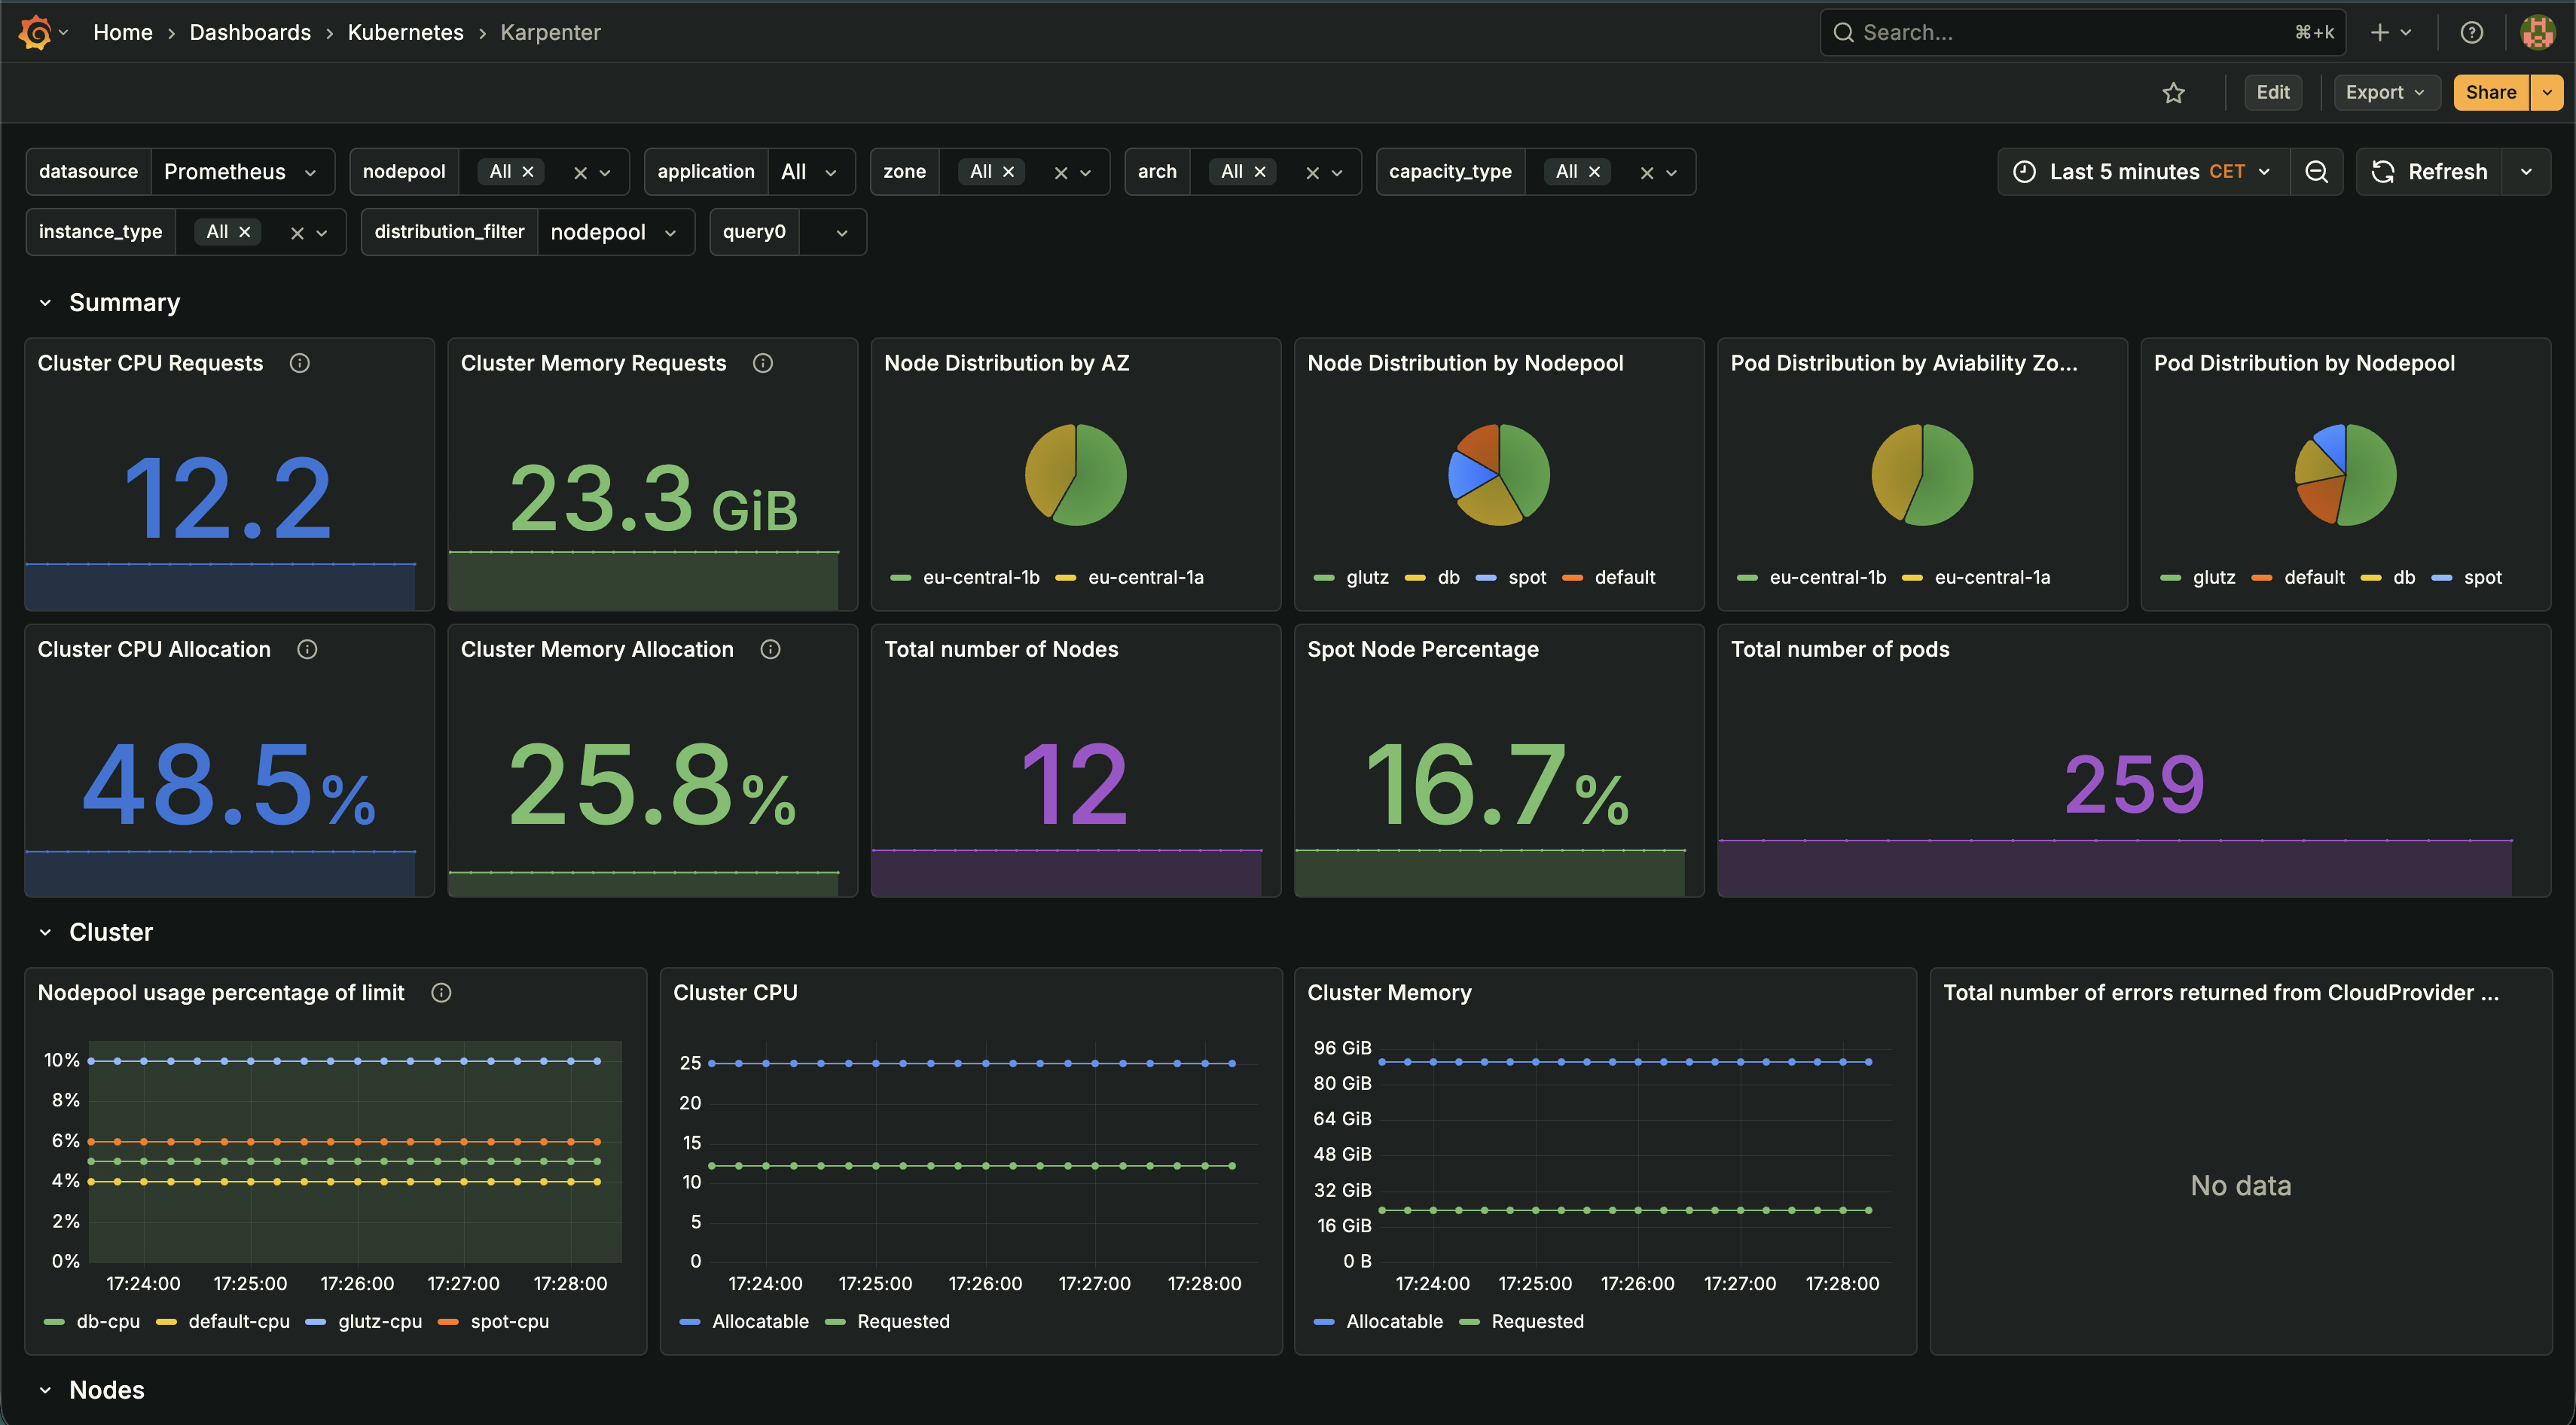
- Karpenter ImplementationReplaced Cluster Autoscaler with Karpenter for more intelligent node provisioning. Karpenter's bin-packing algorithm and faster node launch times (sub-minute vs. 2-3 minutes) improved cluster utilization from 45% to 75%. The system now automatically selects optimal instance types based on pod requirements, resulting in better cost-efficiency. Planning a similar migration? See our complete Cluster Autoscaler to Karpenter Migration Guide 2026 for step-by-step patterns and zero-downtime strategies.
- Node Size OptimizationAnalyzed node-level metrics including CPU allocation, memory allocation, and pod distribution. Right-sized node instance types to better match workload requirements, eliminating wasted capacity. Optimized node pools for different workload types (database, application, spot workloads) to maximize utilization while maintaining performance SLAs.
EC2-Other (Data Transfer) Optimization
EC2-Other costs, primarily driven by NAT Gateway data transfer, were consuming a significant portion of the budget. Through deep analysis of VPC Flow Logs and application behavior, we identified and eliminated unnecessary data transfer.
- NAT Gateway Data Transfer AnalysisAnalyzed VPC Flow Logs to identify the root cause of high NAT Gateway data transfer costs. Discovered that database backups were being uploaded to S3 over NAT Gateways without compression. The backups were being transferred as plain, uncompressed files, resulting in 10x more data transfer than necessary.
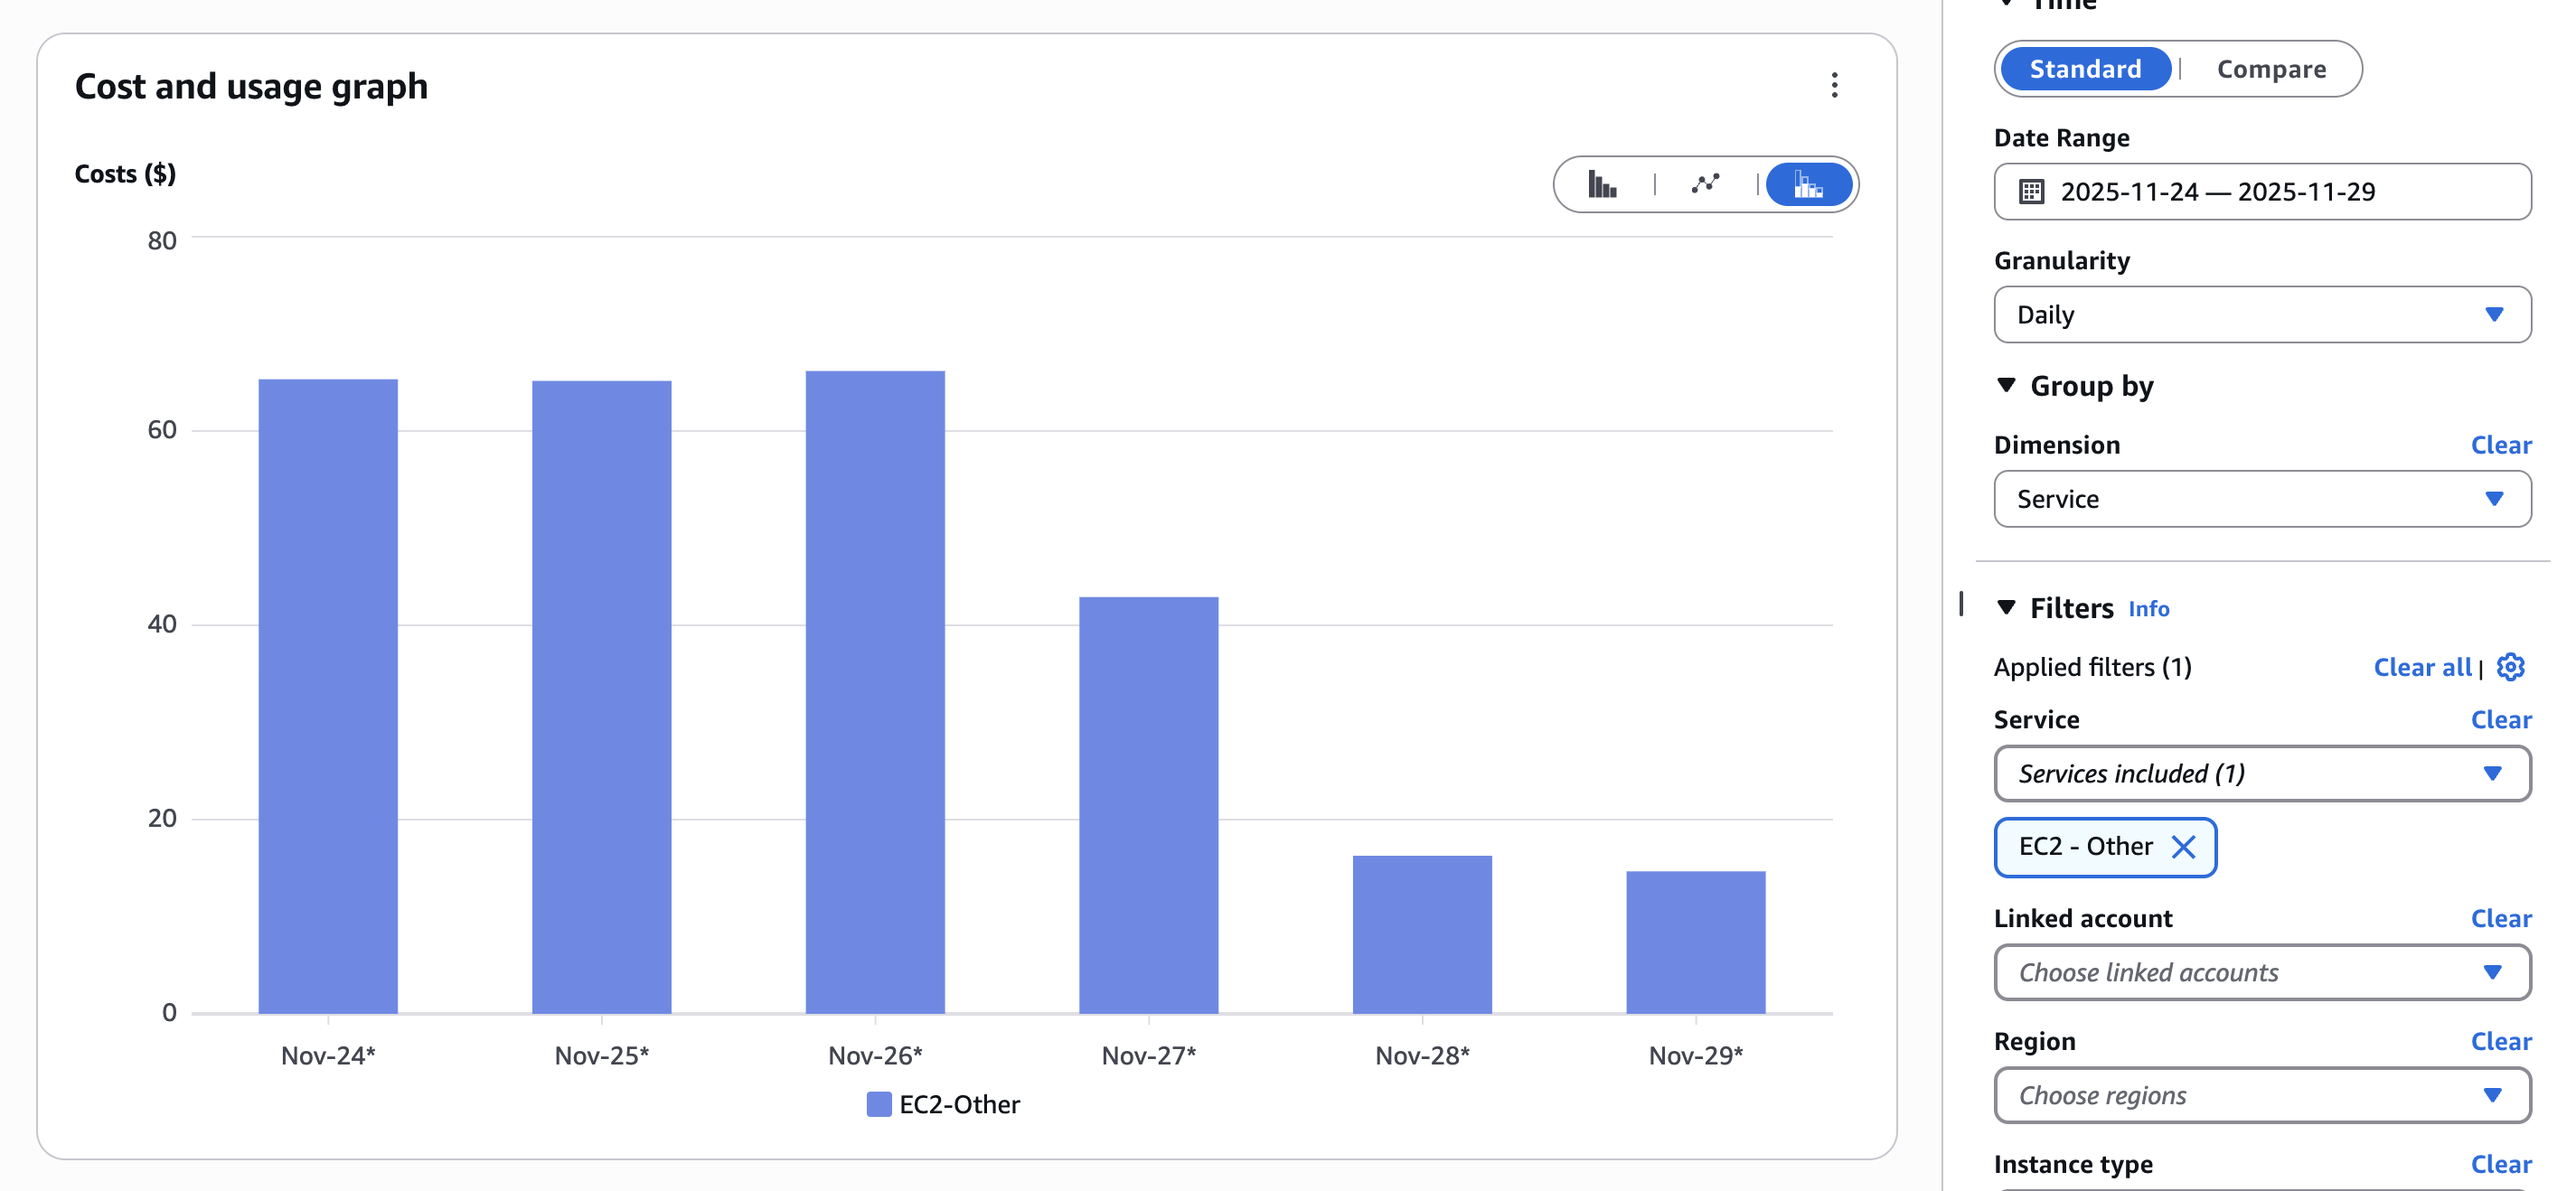
- Backup Compression ImplementationImplemented gzip compression for all backup files before upload to S3. This simple change reduced data transfer by 90%, cutting NAT Gateway costs from $65/day to approximately $6.50/day. The compression added minimal CPU overhead while dramatically reducing network costs.
- Resource CleanupConducted a comprehensive audit of unused AWS resources:
- Removed unused EBS snapshots (saving $200/month)
- Deleted orphaned Elastic IPs not attached to running instances
- Cleaned up old AMIs and snapshots beyond retention policy
- Terminated idle EC2 instances in non-production environments
S3 Storage Optimization
All data was stored in S3 Standard storage class, regardless of access patterns. By implementing intelligent lifecycle policies and moving data to appropriate storage tiers, we achieved significant storage cost reductions without impacting application performance.
- Storage Class MigrationAnalyzed S3 access patterns using CloudWatch metrics and S3 Storage Class Analysis. Implemented lifecycle policies to automatically transition data:
- Standard-IA: For data accessed less than once per month (50% cost reduction)
- Glacier Instant Retrieval: For archival data with infrequent access (68% cost reduction)
- Glacier Flexible Retrieval: For long-term backups (80% cost reduction)
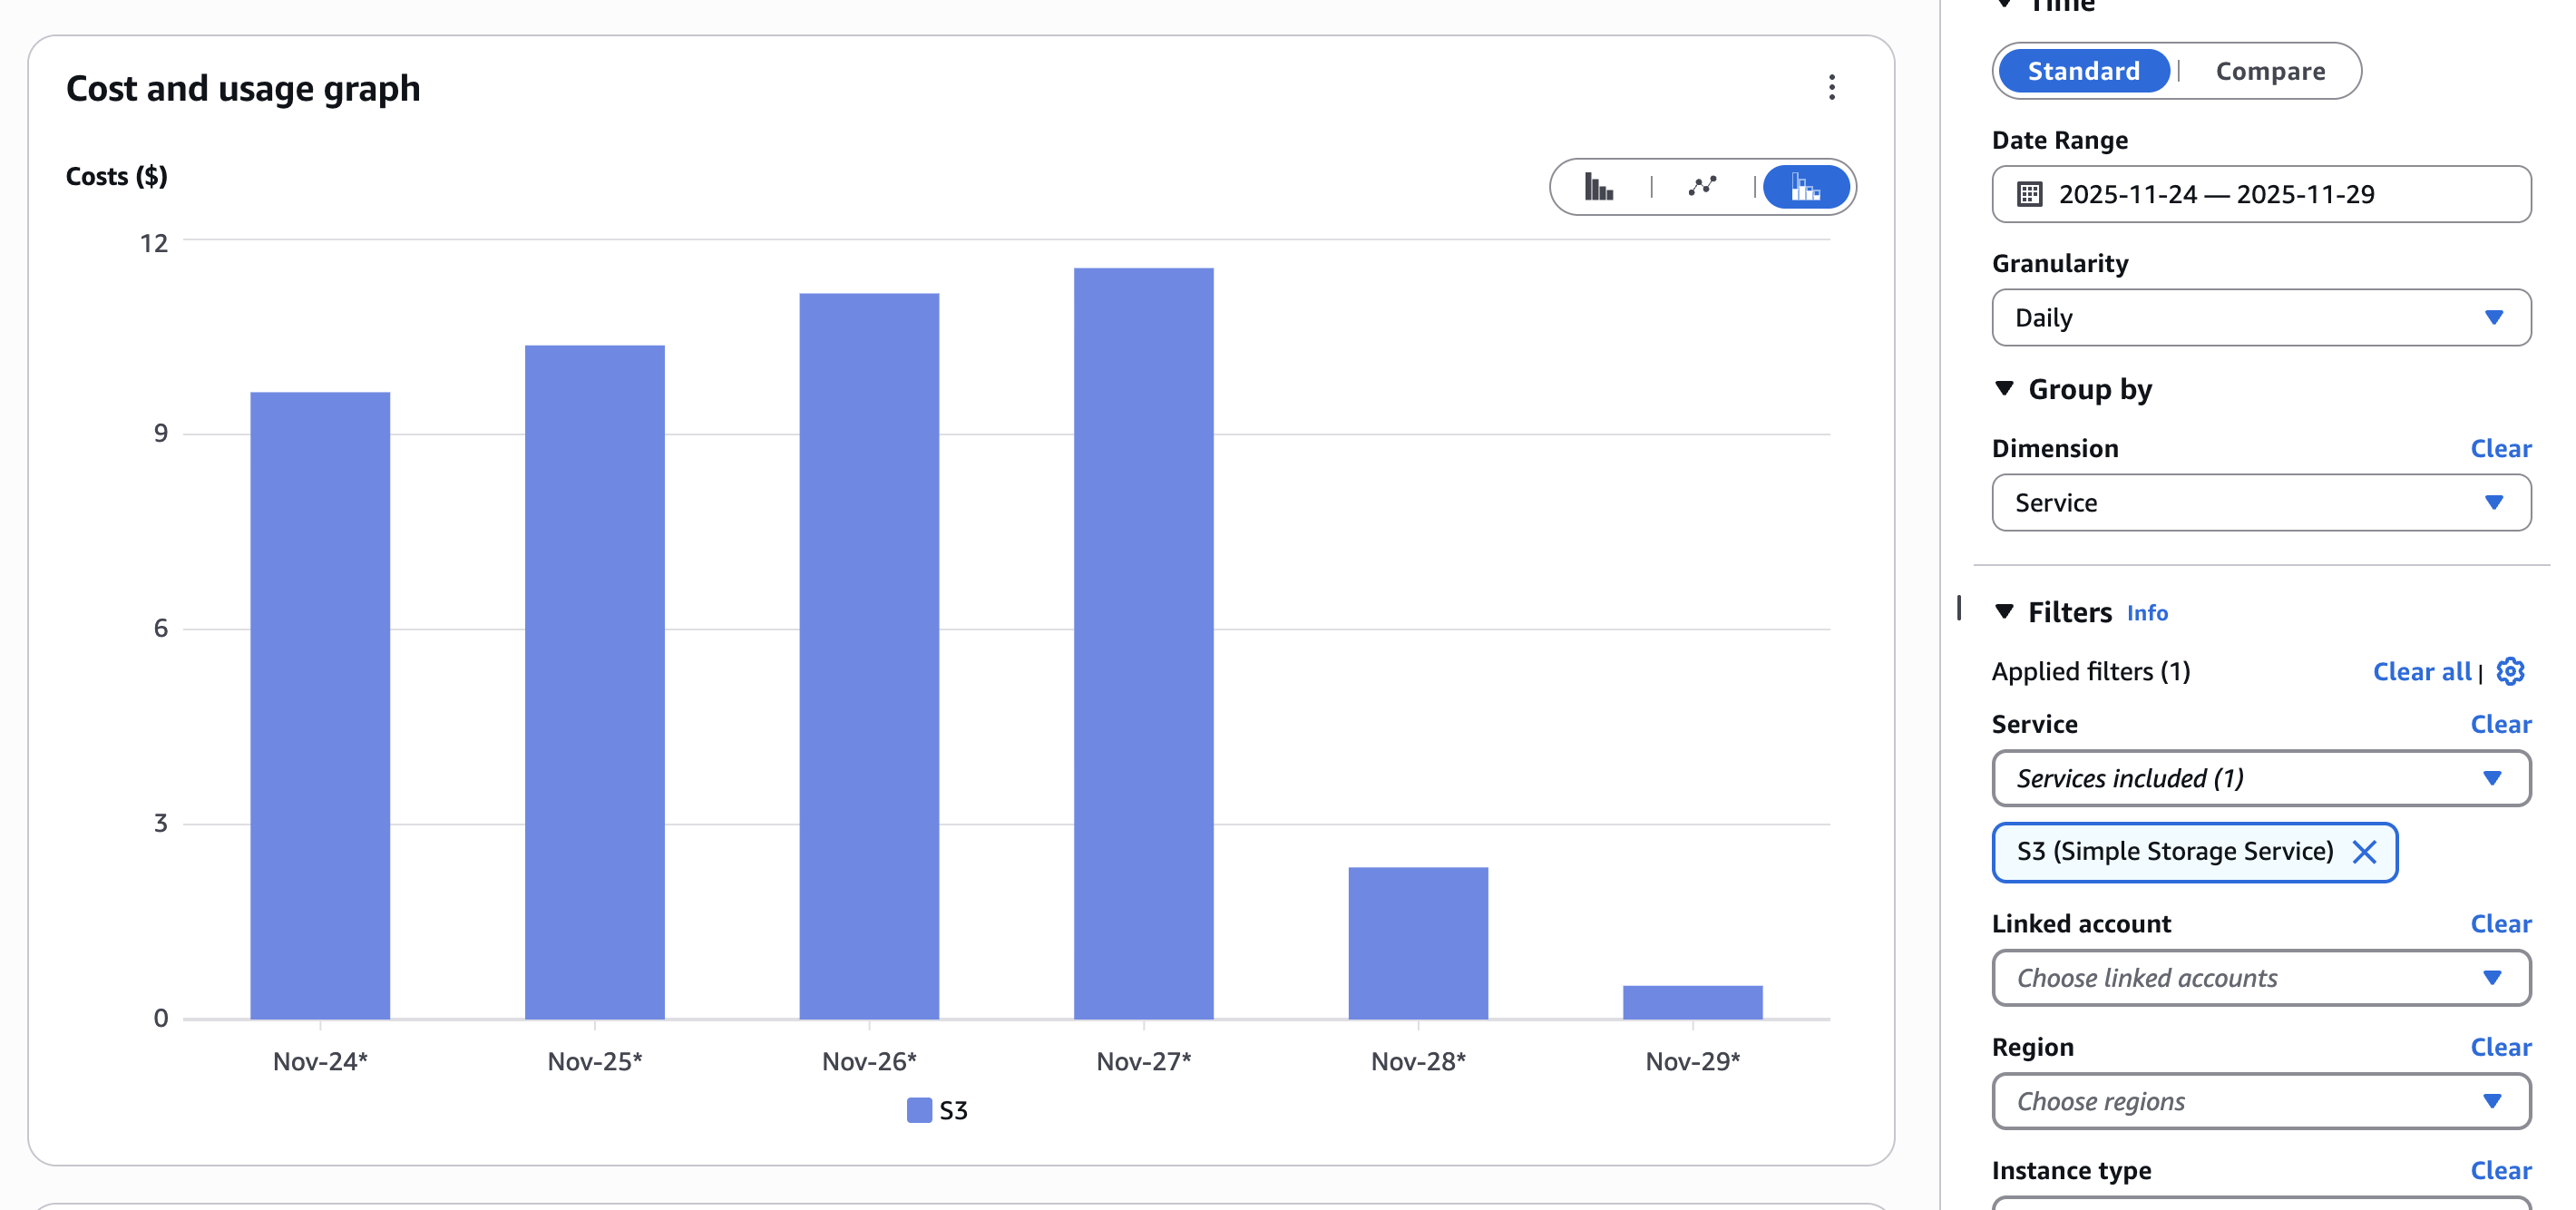
- Backup Lifecycle ManagementImplemented automated backup lifecycle policies aligned with Recovery Point Objectives (RPO). Automated deletion of backups beyond retention requirements, reducing storage costs by eliminating unnecessary long-term retention. Configured intelligent tiering for backup data that transitions between storage classes based on access patterns.
The Results
Key Achievements
- 72% overall cost reduction - Reduced monthly AWS spend from $2,904 to $810 across EC2, S3, and data transfer services, saving $25,128 annually
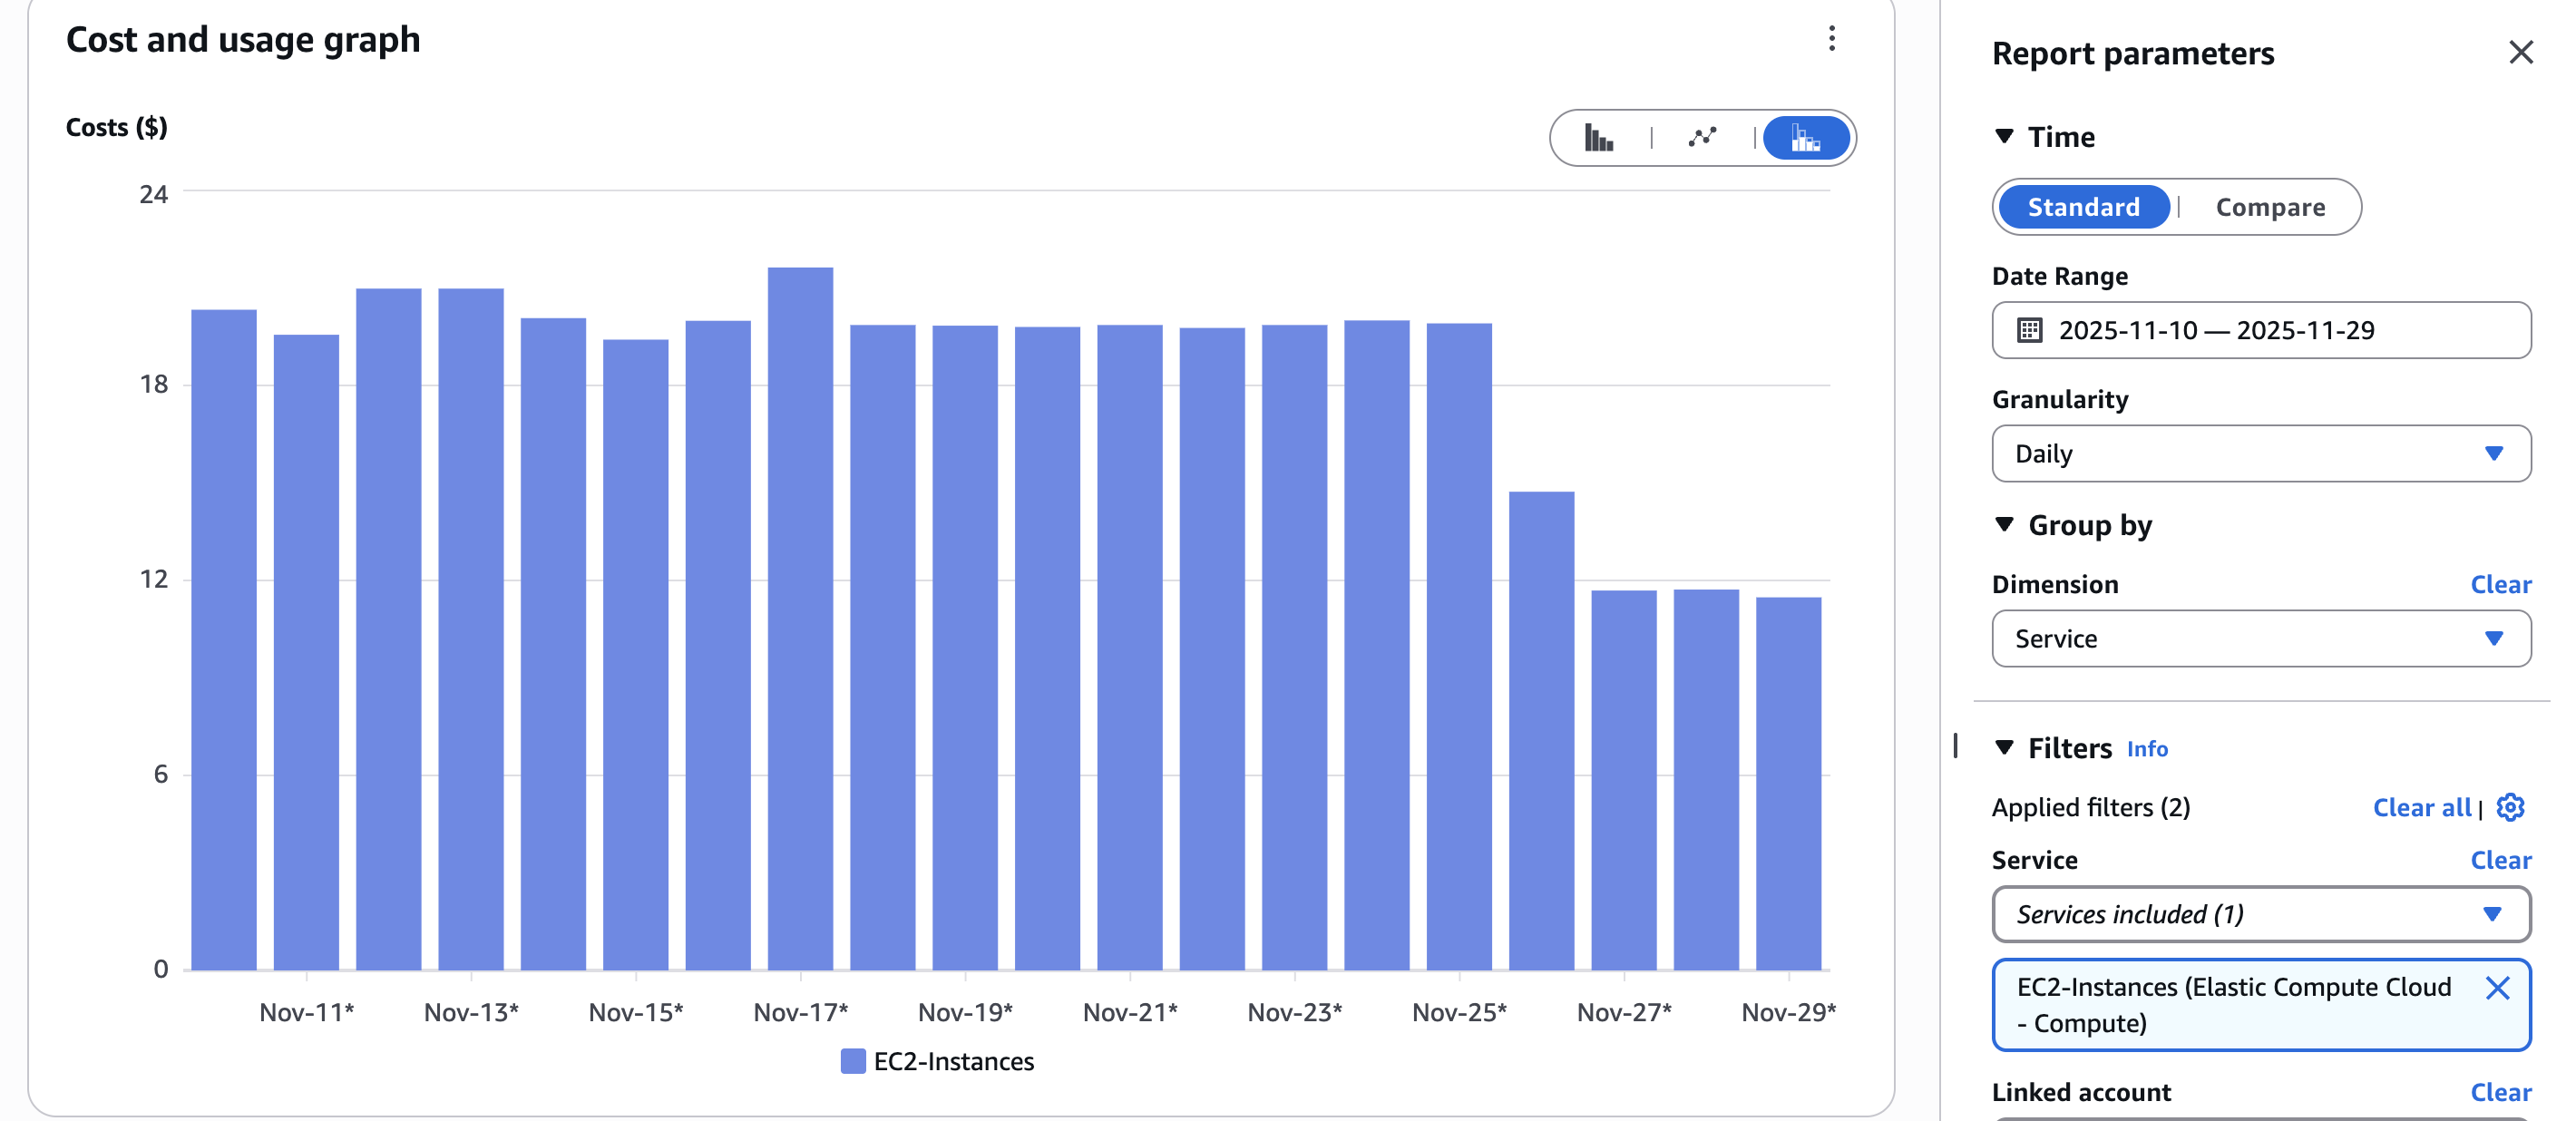
- EC2 costs reduced by 42% - Through spot instances, right-sizing, and Karpenter optimization
- EC2-Other costs reduced by 77% - Eliminated unnecessary NAT Gateway data transfer through backup compression
- S3 costs reduced by 96% - Intelligent storage tiering and lifecycle management
- Improved cluster utilization - From 45% to 75% through Karpenter and resource optimization
- Zero performance impact - All optimizations maintained or improved application performance
- Automated cost management - Lifecycle policies and Karpenter ensure ongoing cost efficiency
Technical Implementation
Monitoring & Metrics
Throughout the optimization process, we leveraged comprehensive monitoring to make data-driven decisions:
- Karpenter DashboardReal-time visibility into node distribution, pod allocation, CPU/memory utilization, and spot instance percentage. Enabled proactive optimization and capacity planning.Karpenter Dashboard: Node distribution, pod allocation, and cluster metrics
- Node Exporter MetricsDetailed node-level metrics including CPU pressure, memory usage, I/O wait, and system load. Used to right-size instances and identify underutilized nodes.
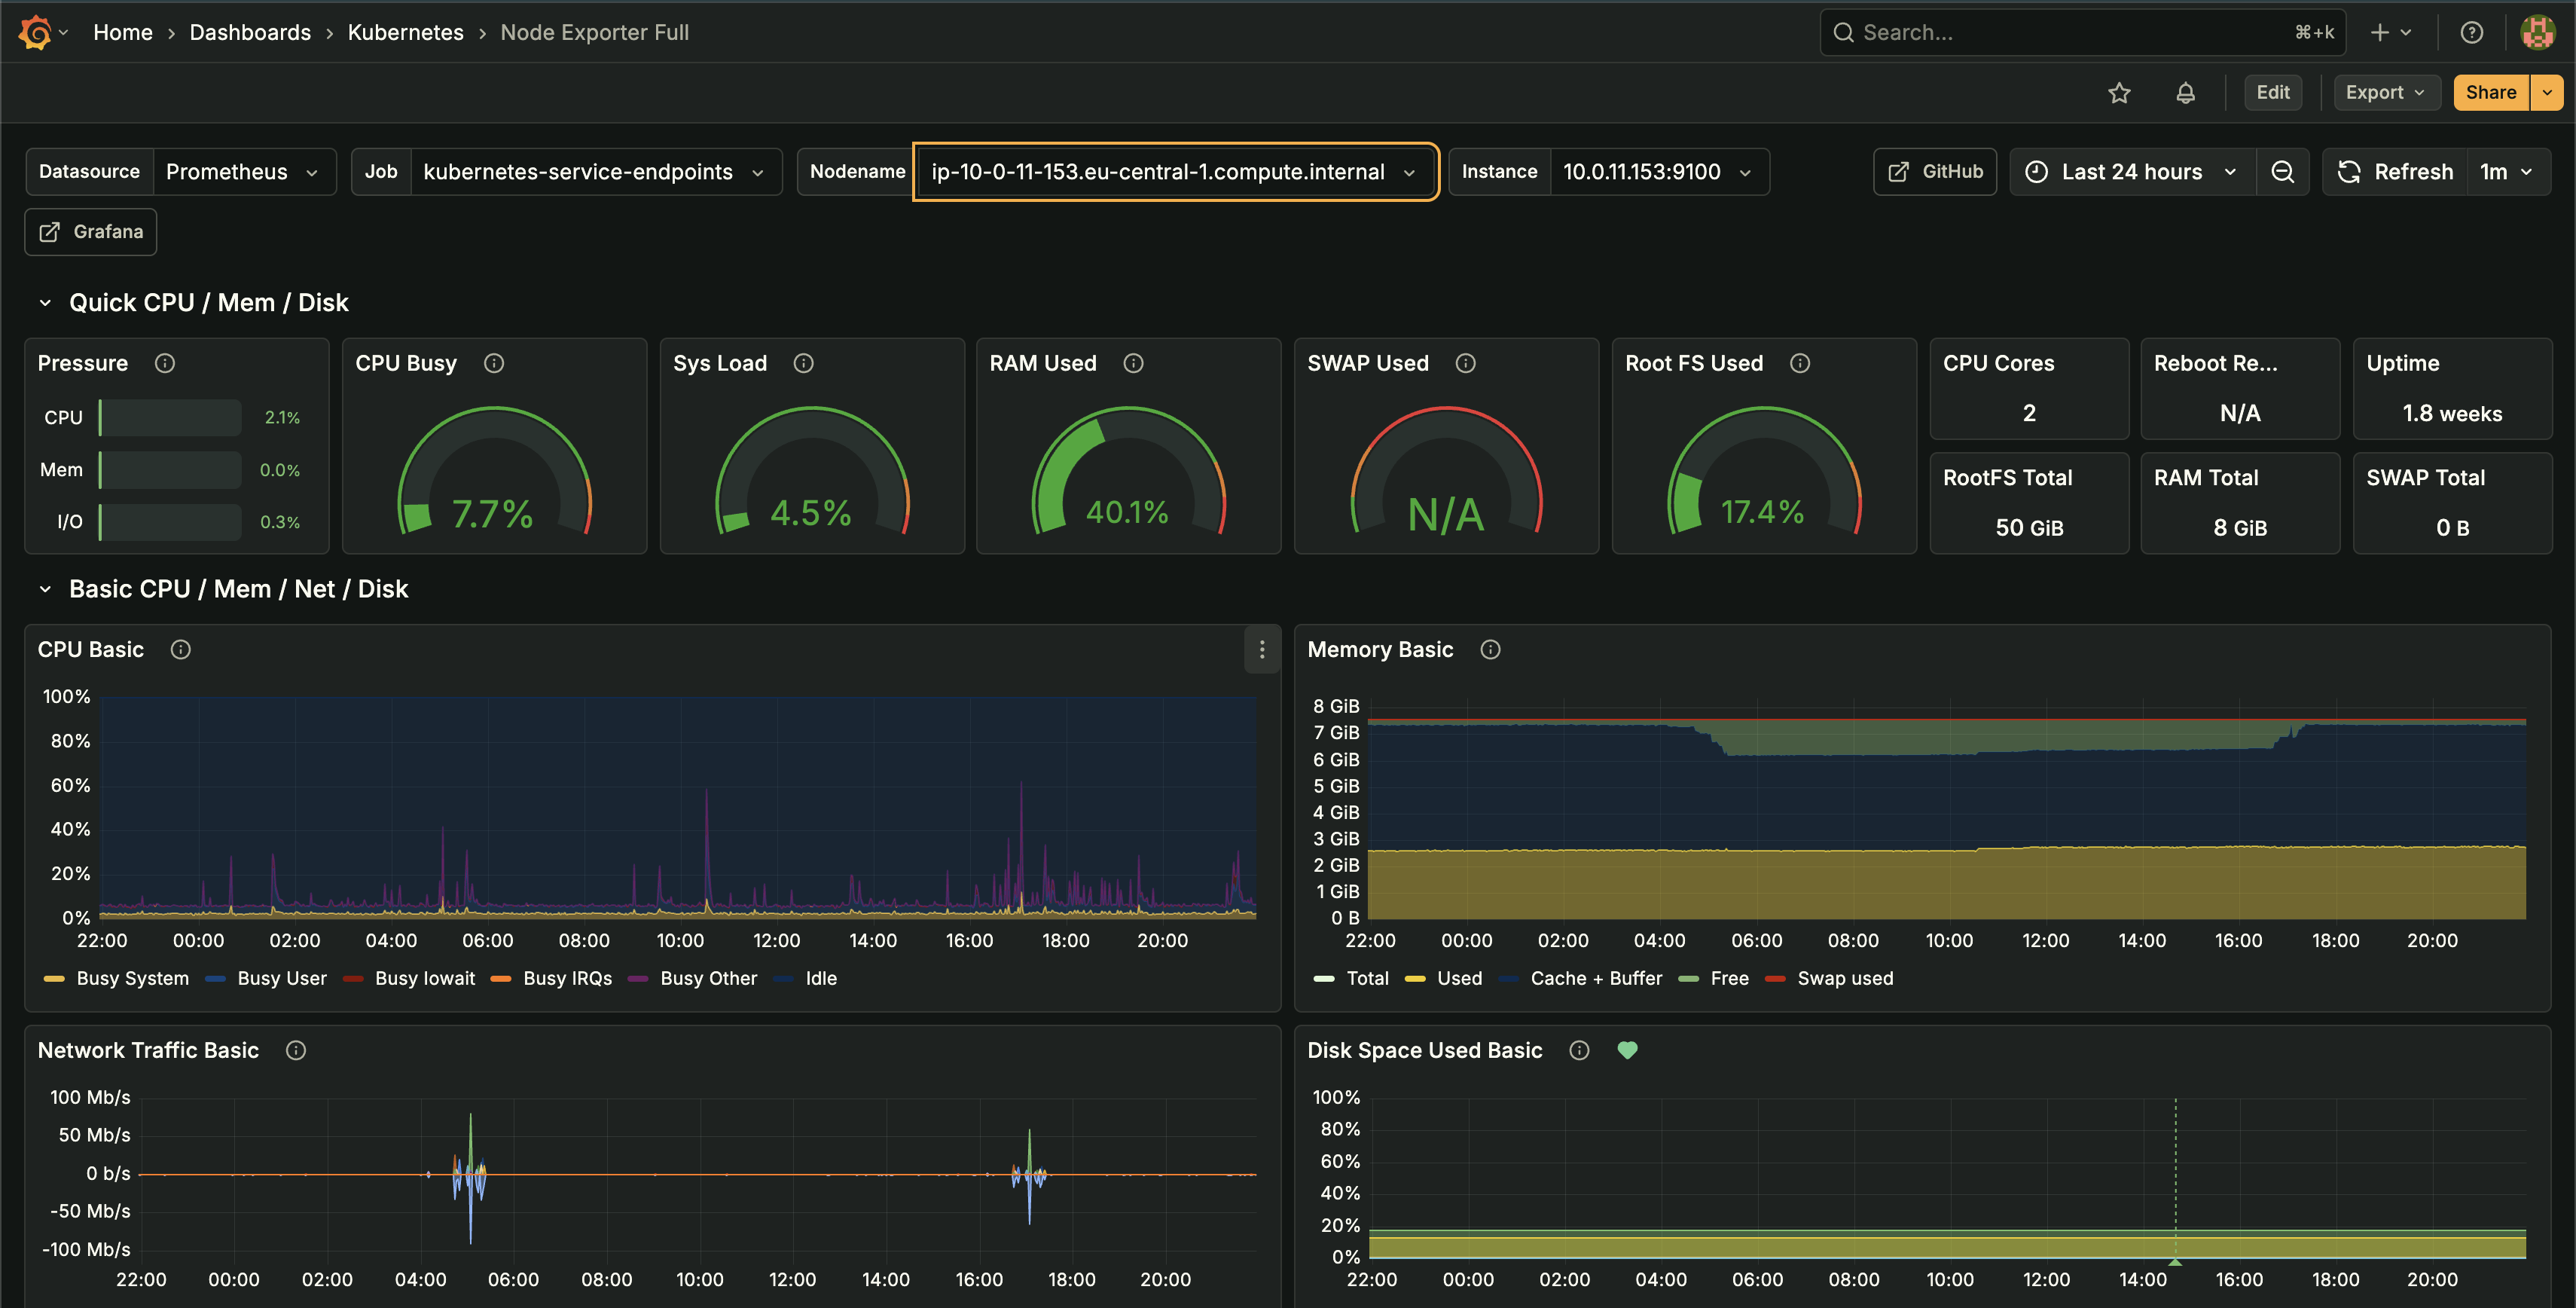 Node Exporter Dashboard: CPU pressure, memory usage, I/O wait, and system load metrics
 - Kubernetes Pod Resource MonitoringTracked actual CPU and memory usage vs. requests/limits across all containers. Identified over-provisioned pods and optimized resource allocation to match real-world utilization patterns.
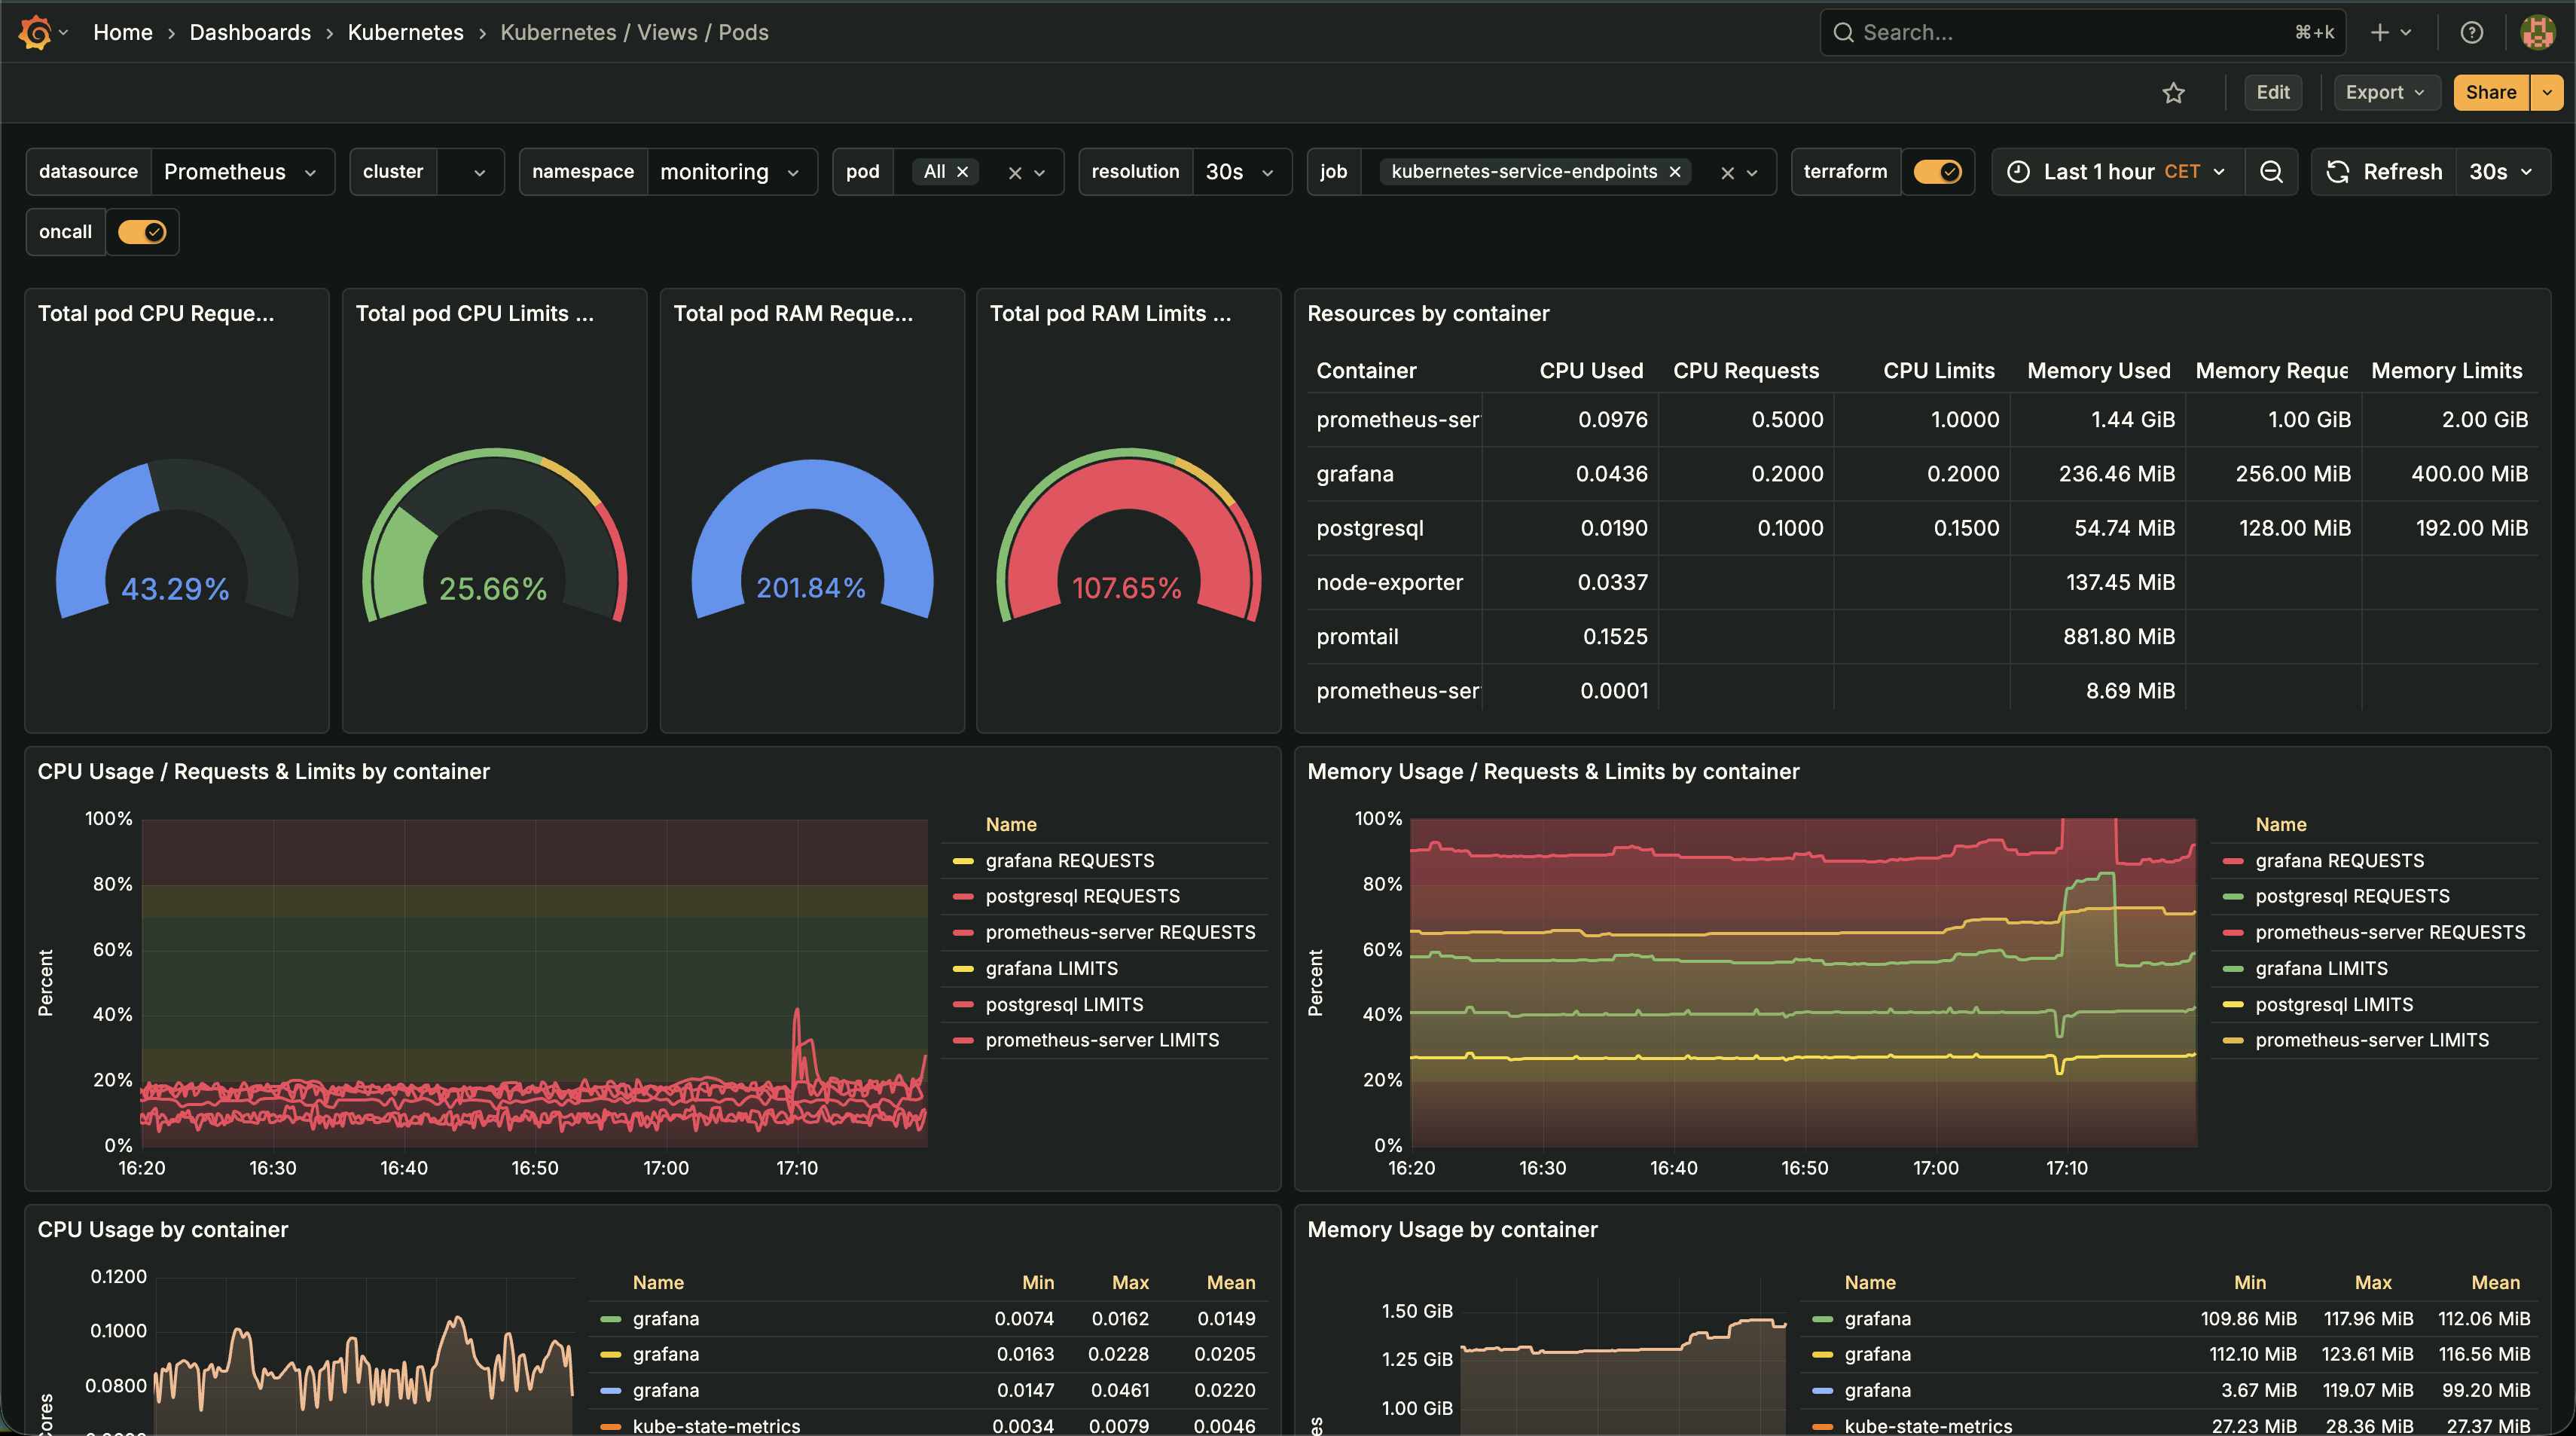 Kubernetes Pod Resource Monitoring: CPU and memory usage vs. requests/limits across all containers
 - AWS Cost & Usage ReportsDaily cost breakdowns by service, instance type, and usage pattern. Enabled identification of cost drivers and measurement of optimization impact.
Lessons Learned
Key Insights
- Data-driven optimization beats guesswork: Comprehensive monitoring and metrics analysis revealed optimization opportunities that weren't obvious from high-level cost reports alone.
- Small changes, big impact: Simple fixes like backup compression and storage tiering delivered massive cost savings with minimal engineering effort.
- Right-sizing is an ongoing process: Resource requirements change as applications evolve. Regular reviews and automated optimization tools like Karpenter ensure continued efficiency.
- Spot instances are production-ready: With proper architecture (stateless workloads, multi-AZ distribution, graceful degradation), spot instances can deliver significant savings without compromising reliability.
- Lifecycle management matters: Automated policies for backups, snapshots, and storage tiering prevent cost creep over time.
Ready to Optimize Your AWS Costs?
Get a free infrastructure audit and discover how much you could save. We'll analyze your setup and provide a detailed optimization roadmap.