The Challenge
A B2B SaaS startup was experiencing rapid user growth from 5,000 to 15,000 active users. For teams managing similar scaling challenges, see our cloud-native guides. Understanding Kubernetes scaling is essential for growth. in just 6 months. The application was struggling under the load: slow response times, database connection timeouts, and occasional outages during peak traffic. The engineering team was spending increasing time on infrastructure firefighting instead of building features. Hiring a DevOps engineer would cost $150K+ annually, but the startup needed a solution that could scale immediately without the overhead of a full-time hire.
Note: All screenshots in this case study have been anonymized. Application names, pod names, and service identifiers have been redacted to protect client confidentiality.
Intelligent Kubernetes Autoscaling
The application was running on a fixed-size Kubernetes cluster that couldn't adapt to traffic spikes. During peak hours, pods would queue requests, causing slow response times. We implemented Karpenter for node-level autoscaling and Horizontal Pod Autoscaler (HPA) for application-level scaling, enabling the infrastructure to automatically scale up during traffic spikes and scale down during low-traffic periods.
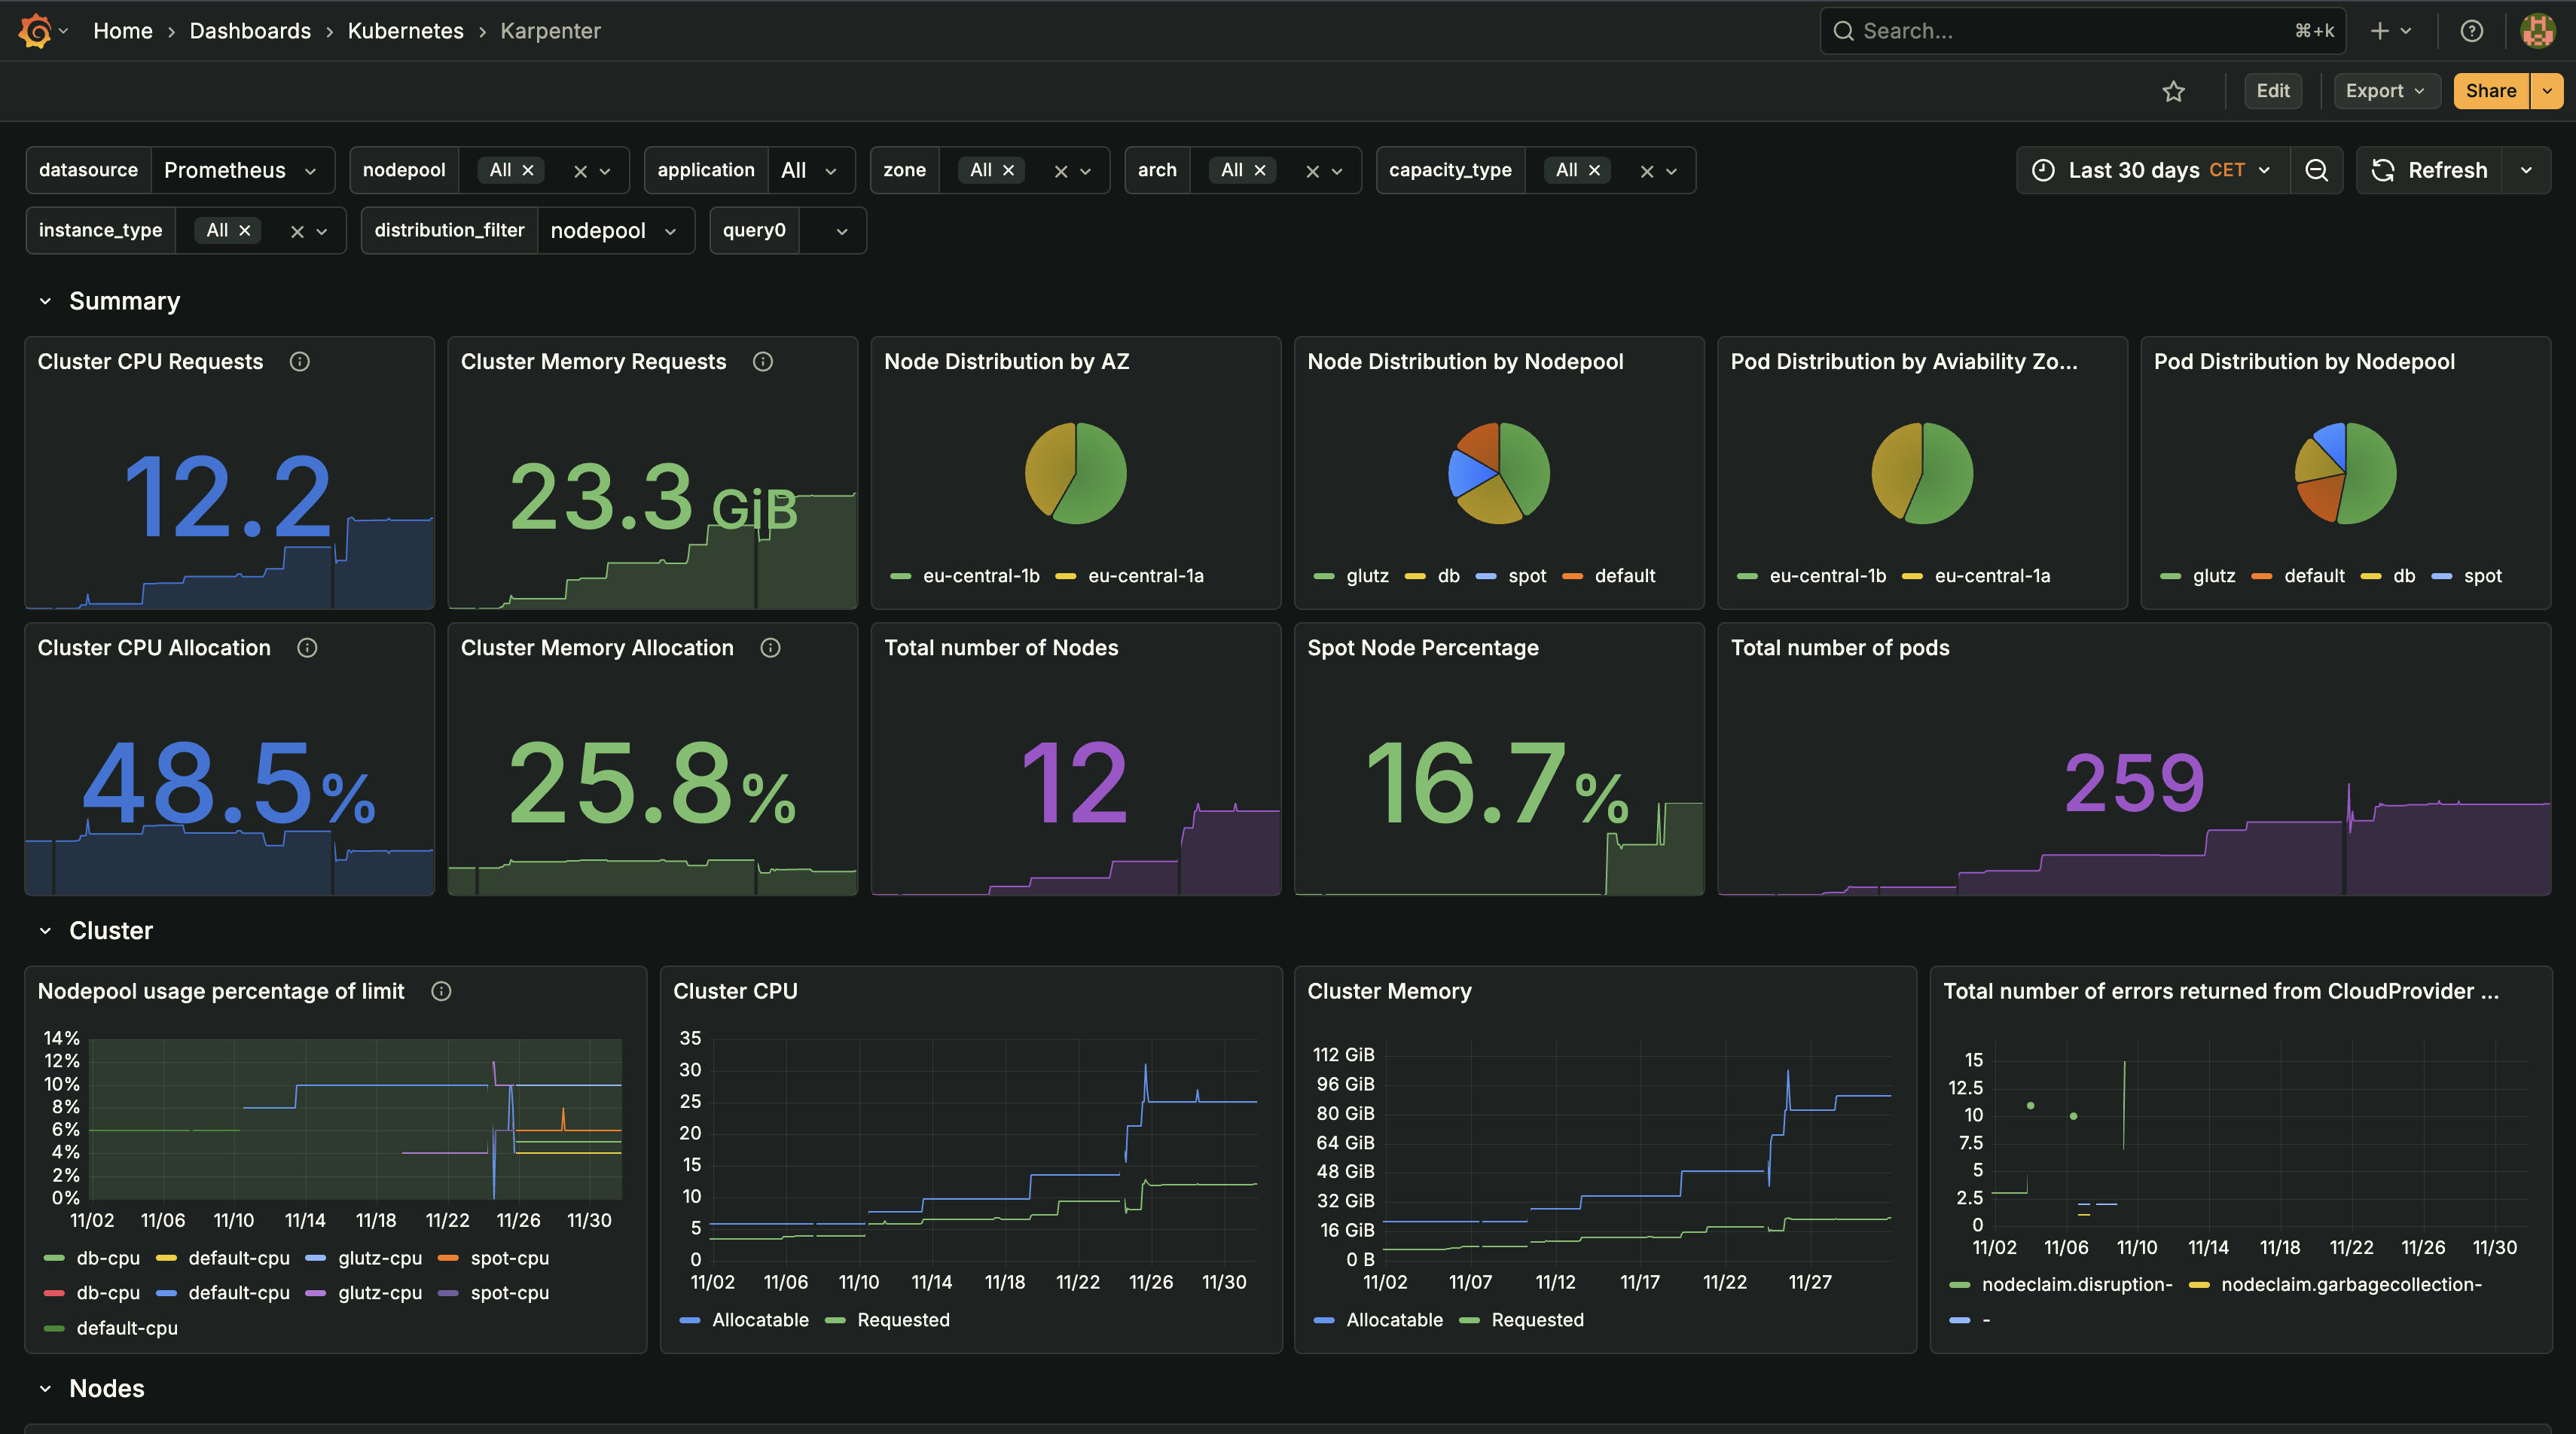
- Karpenter Node AutoscalingReplaced Cluster Autoscaler with Karpenter for faster, more efficient node provisioning:
- Rapid Node Provisioning: Karpenter provisions nodes in 30-60 seconds (vs. 3-5 minutes with Cluster Autoscaler), enabling faster response to traffic spikes
- Cost Optimization: Karpenter selects optimal instance types based on pod requirements, reducing costs by 25-30% compared to fixed node sizes
- Spot Instance Integration: Automatically uses spot instances for stateless workloads, achieving 60-70% cost savings on compute
- Multi-AZ Distribution: Ensures pods are distributed across availability zones for high availability
- Node Consolidation: Automatically consolidates underutilized pods onto fewer nodes during low-traffic periods
- Horizontal Pod Autoscaling (HPA)Implemented HPA for application pods to scale based on CPU, memory, and custom metrics:
- CPU-Based Scaling: Pods scale up when CPU usage exceeds 70% and scale down when below 30%
- Memory-Based Scaling: Monitors memory utilization and scales pods before OOM conditions
- Custom Metrics: Integrated request rate and queue depth metrics for more intelligent scaling decisions
- Scaling Policies: Configured scale-up policies to be aggressive (add pods quickly) and scale-down policies to be conservative (remove pods slowly)
- Min/Max Pod Limits: Set minimum replicas to handle baseline traffic and maximum replicas to prevent runaway scaling
PostgreSQL Read Replica Architecture
The single PostgreSQL database was becoming a bottleneck. Read queries were blocking write operations, and connection pool exhaustion was causing timeouts. We implemented a read replica architecture with 4 dedicated read replicas, distributing read traffic and eliminating database contention.
- Read Replica SetupDeployed 4 dedicated PostgreSQL read replicas with streaming replication:
- Streaming Replication: Replicas receive WAL (Write-Ahead Log) updates in real-time, ensuring data consistency with sub-second lag
- Load Balancing: Implemented round-robin load balancing across read replicas, distributing query load evenly
- Health Checks: Automatic failover to healthy replicas if one becomes unavailable
- Read/Write Splitting: Application automatically routes SELECT queries to read replicas and INSERT/UPDATE/DELETE to primary
- Replication Lag Monitoring: Continuous monitoring of replication lag to ensure data freshness
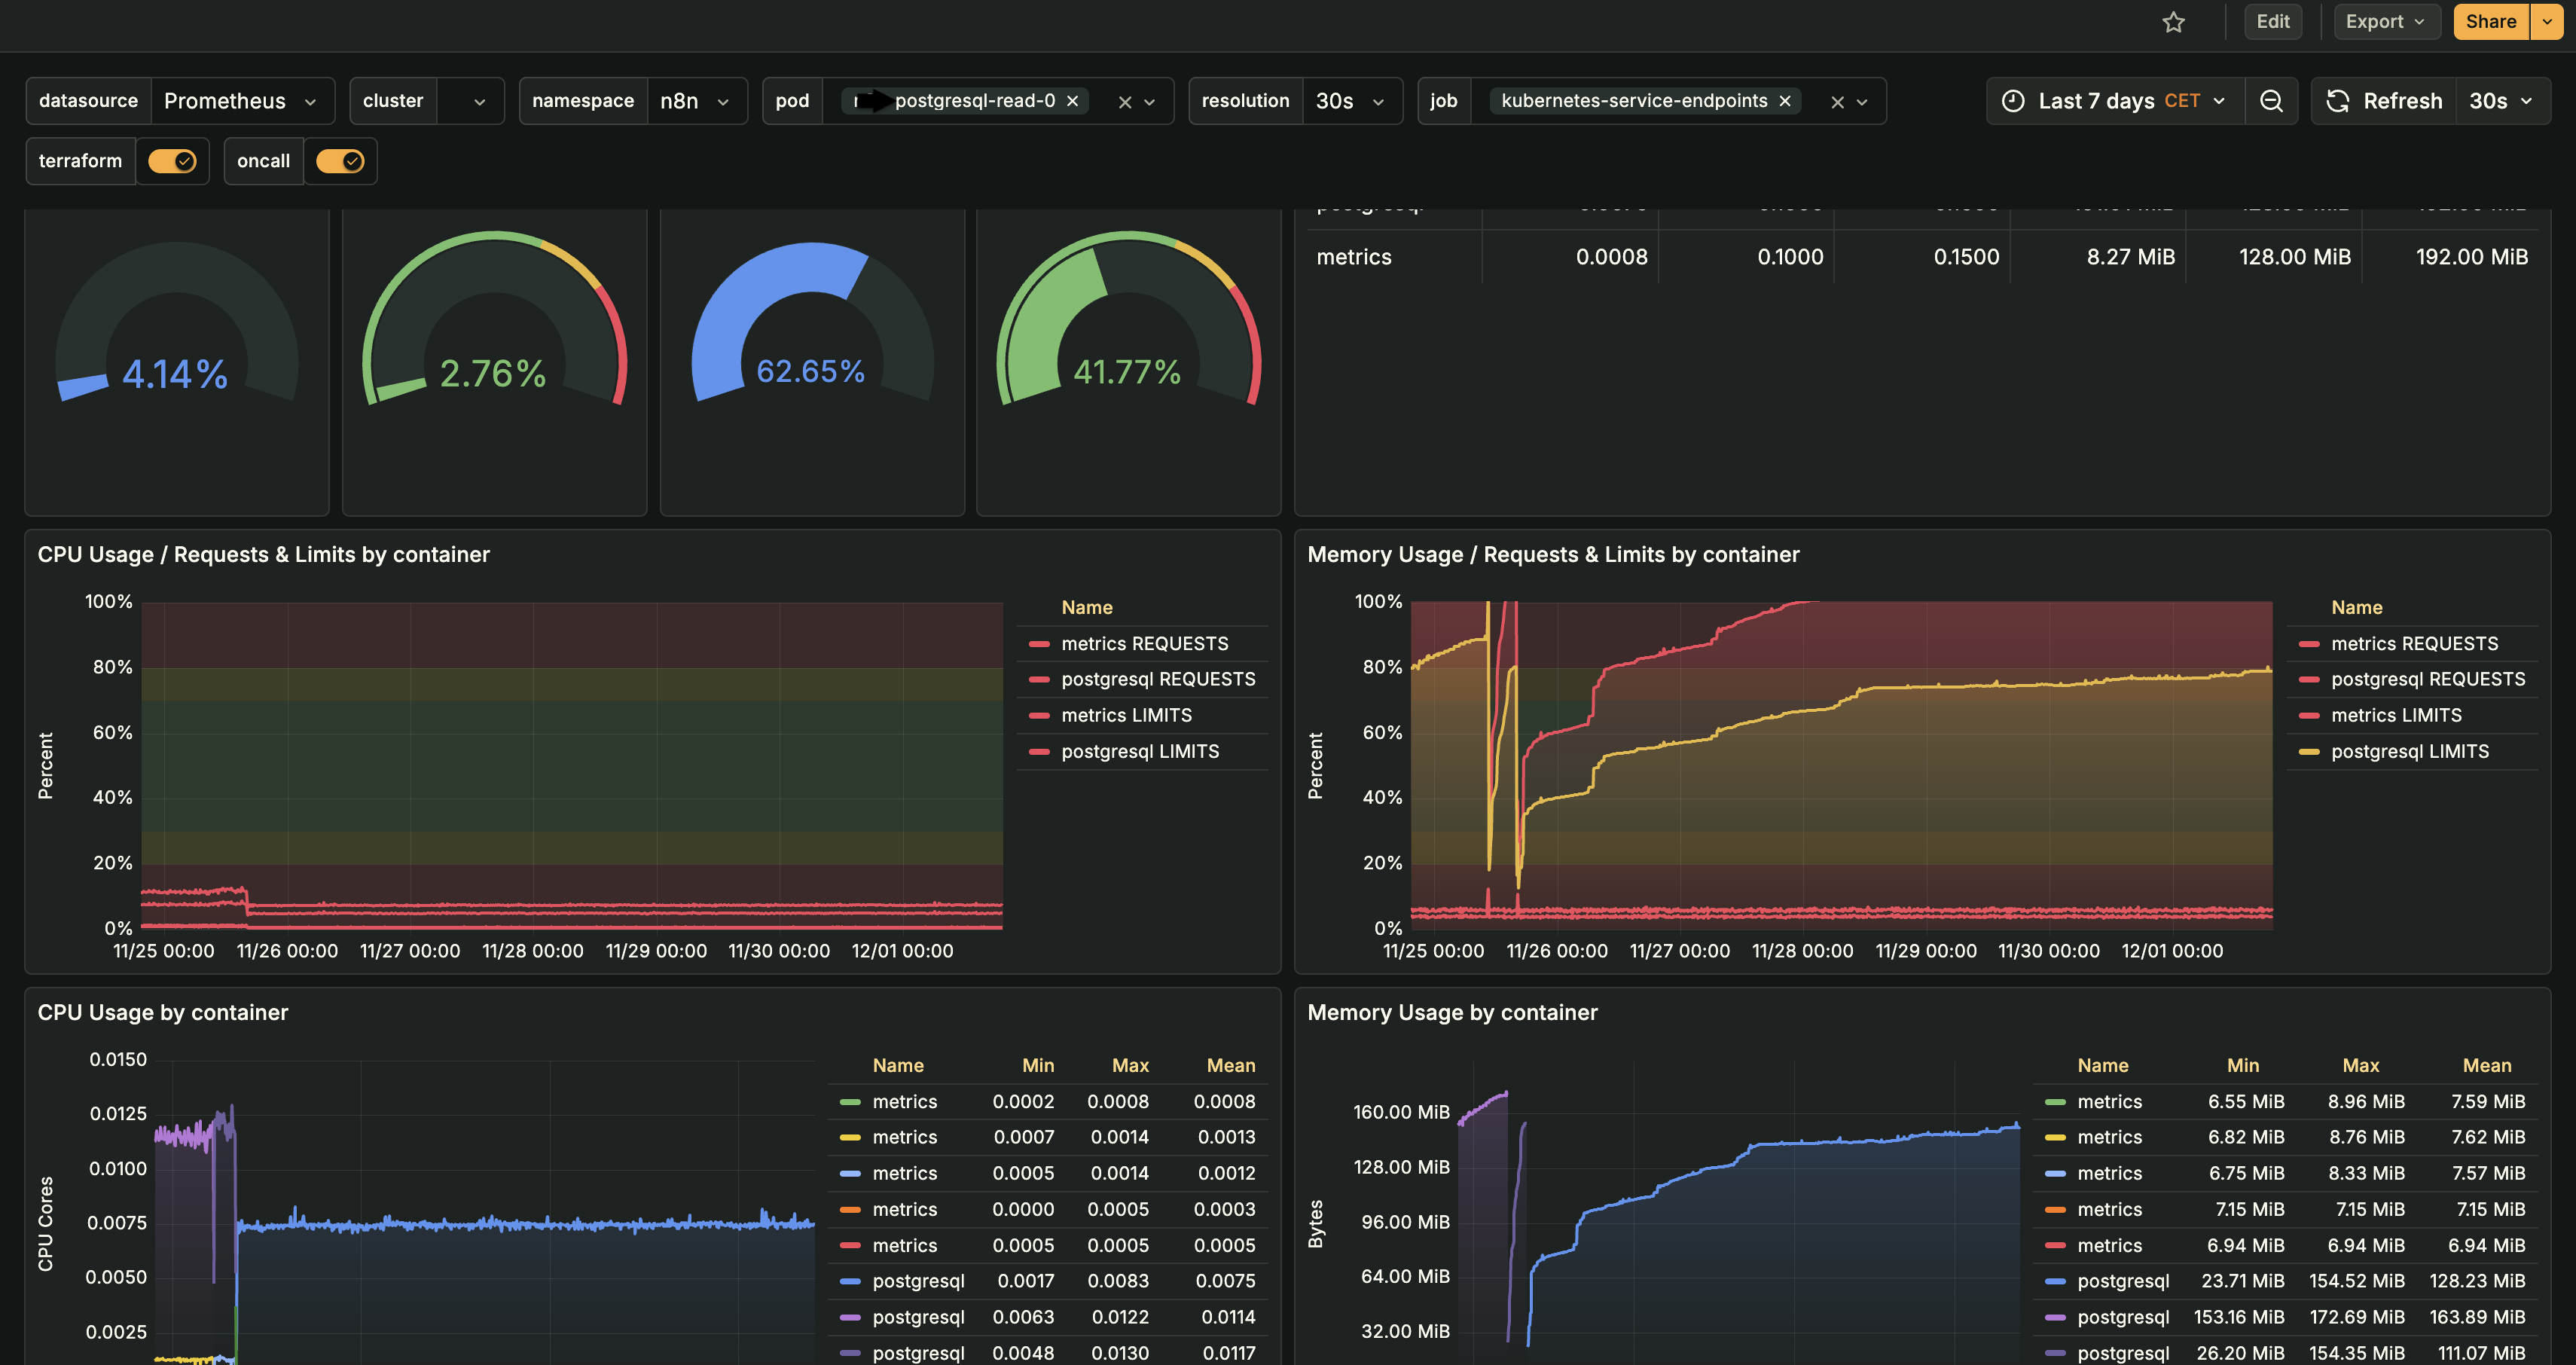
- Read Replica Performance MonitoringImplemented comprehensive monitoring for read replica performance and resource utilization:
- CPU & Memory Tracking: Real-time monitoring of CPU and memory usage per replica pod, enabling proactive resource scaling
- Resource Requests & Limits: Configured optimal resource requests and limits based on actual usage patterns, preventing over-provisioning
- Usage Trends: Track resource usage trends over time to identify scaling needs and optimize capacity planning
- Performance Metrics: Monitor query performance, connection counts, and replication lag for each replica
- Capacity Planning: Use historical data to predict when additional replicas are needed based on growth trends
- Connection Pool OptimizationOptimized database connection pooling to handle increased load:
- PgBouncer Integration: Deployed PgBouncer connection pooler in transaction mode, reducing connection overhead
- Pool Sizing: Configured connection pools based on actual usage patterns (25 connections per replica, 50 for primary)
- Connection Timeout Handling: Implemented graceful connection timeout and retry logic
- Query Timeout: Set query timeouts to prevent long-running queries from blocking connections
Redis Cluster on Kubernetes
The single Redis instance was becoming a bottleneck and single point of failure. Cache misses were increasing, and memory pressure was causing evictions. We migrated to a Redis cluster architecture on Kubernetes, providing horizontal scaling, high availability, and improved performance.
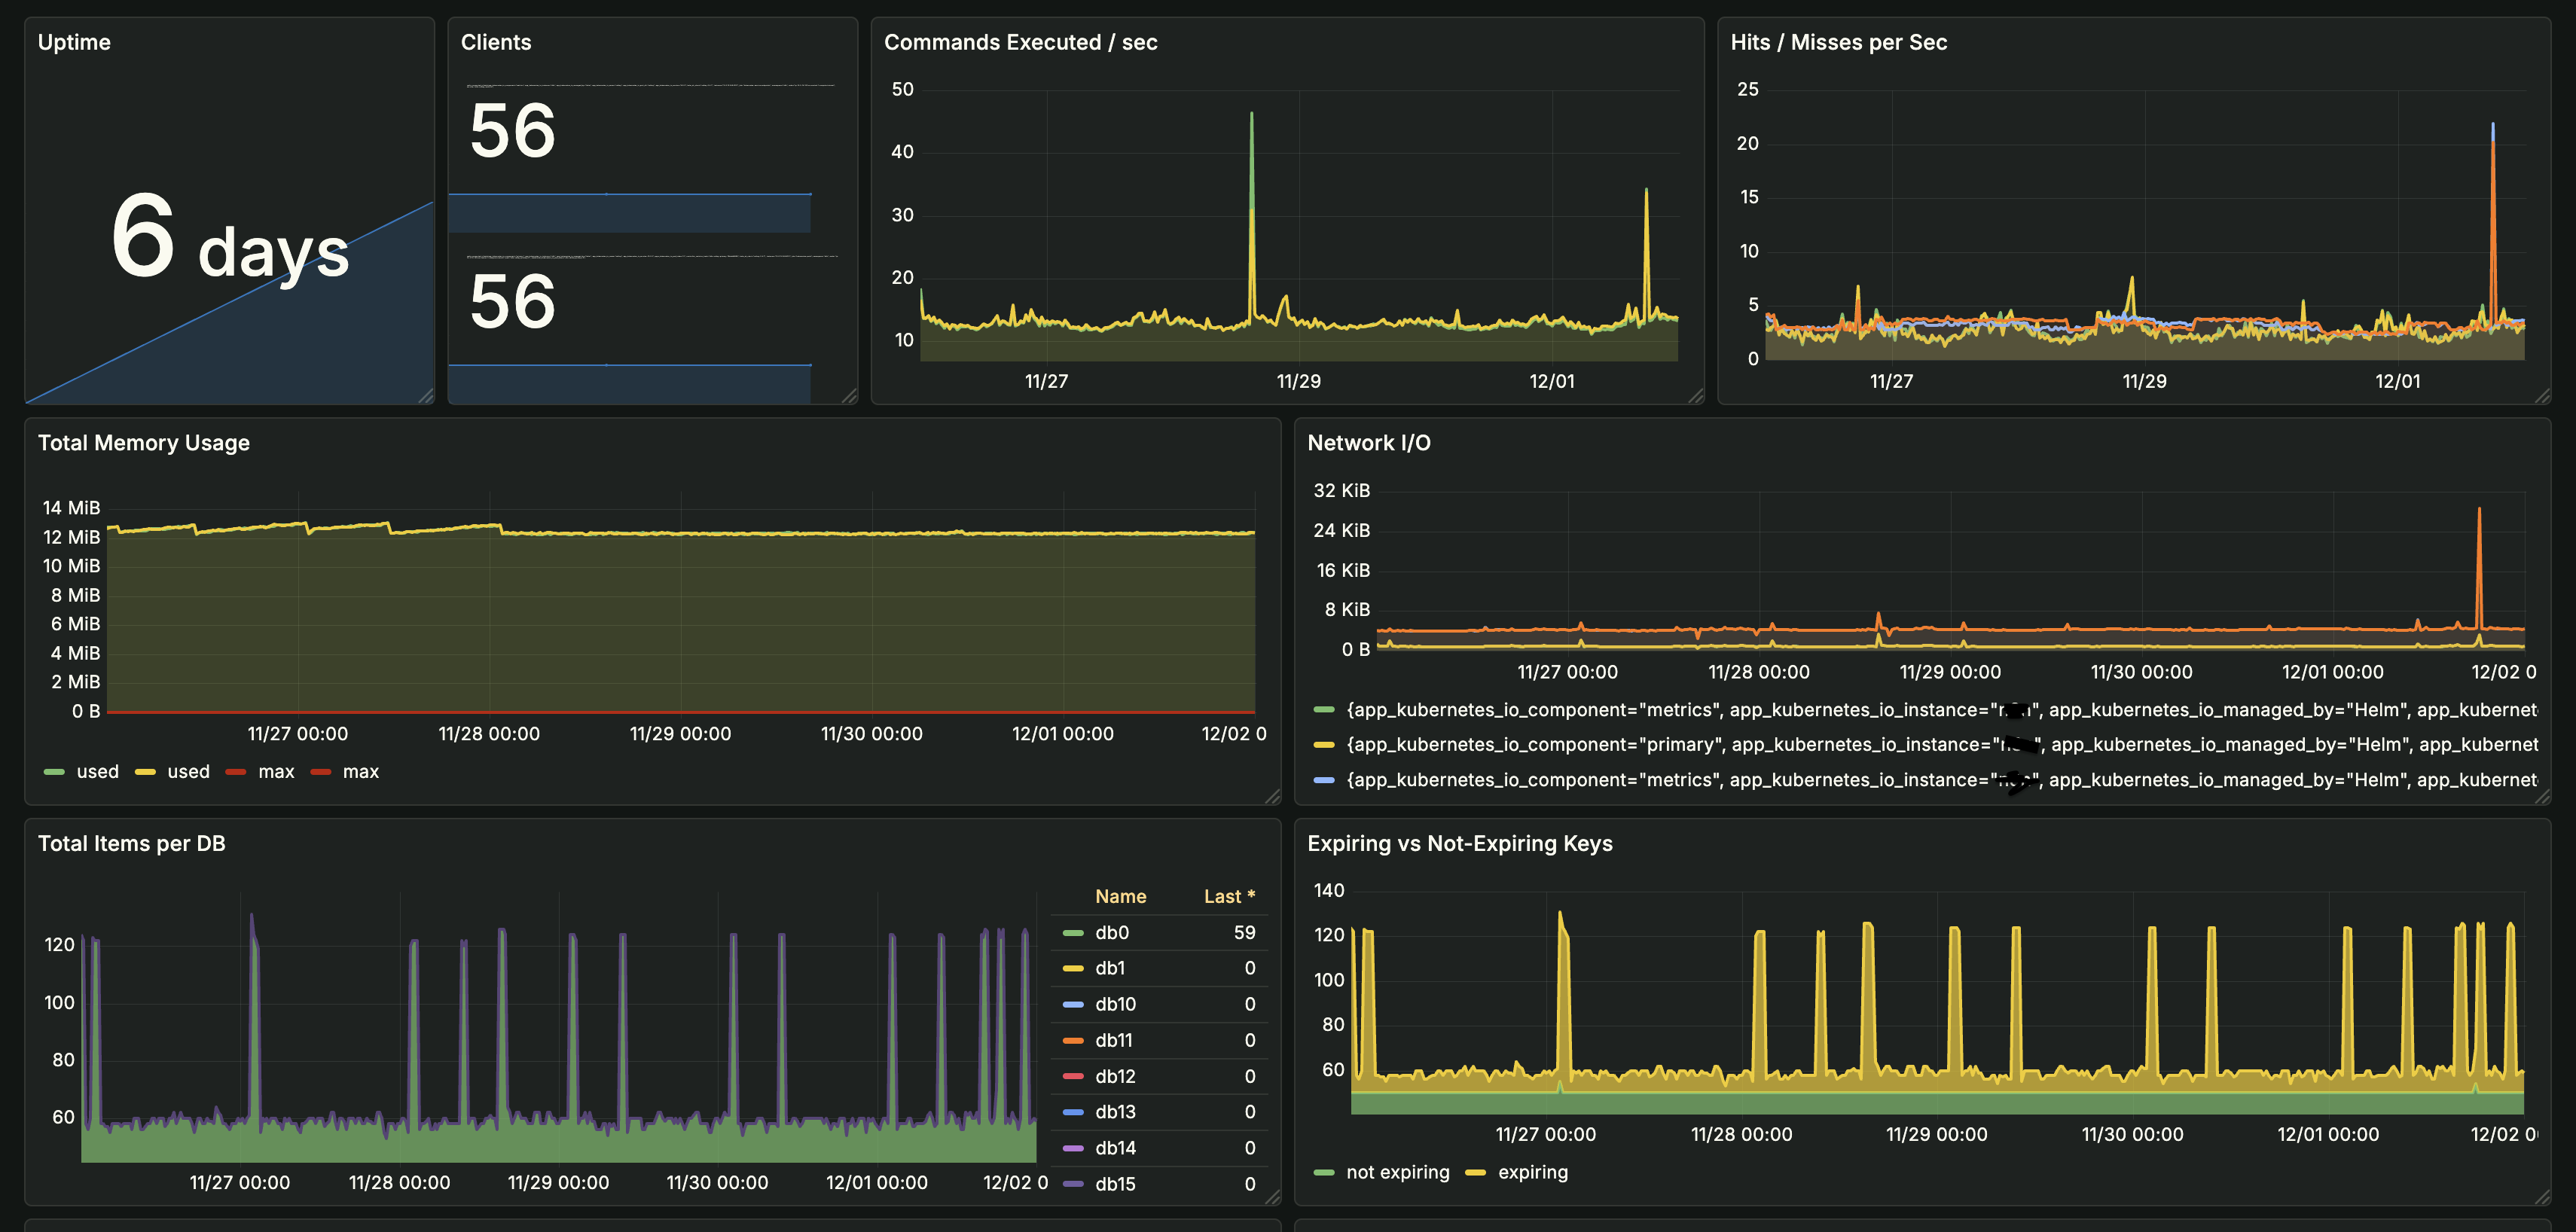
- Redis Cluster ArchitectureDeployed Redis cluster with 6 nodes (3 masters, 3 replicas) on Kubernetes:
- Sharding: Data is automatically sharded across 3 master nodes using consistent hashing
- High Availability: Each master has a replica for automatic failover (3 masters + 3 replicas = 6 nodes)
- Kubernetes StatefulSets: Used StatefulSets for stable network identities and persistent storage
- Pod Disruption Budgets: Ensured at least 2 masters are always available during node maintenance
- Resource Limits: Configured CPU and memory limits to prevent resource contention
- Cache Performance OptimizationOptimized cache strategies to improve hit rates and reduce database load:
- Cache Warming: Pre-populate frequently accessed data during low-traffic periods
- TTL Optimization: Adjusted cache TTLs based on data freshness requirements (short TTL for dynamic data, longer for static)
- Cache Invalidation: Implemented smart cache invalidation on data updates
- Memory Management: Configured eviction policies (allkeys-lru) to prioritize frequently accessed keys
Application Performance Monitoring (APM)
Without visibility into API performance, it was impossible to identify bottlenecks and optimize for scale. We implemented comprehensive APM using Lumigo to track API response times, error rates, and throughput at the endpoint level, providing distributed tracing and real-time performance insights.
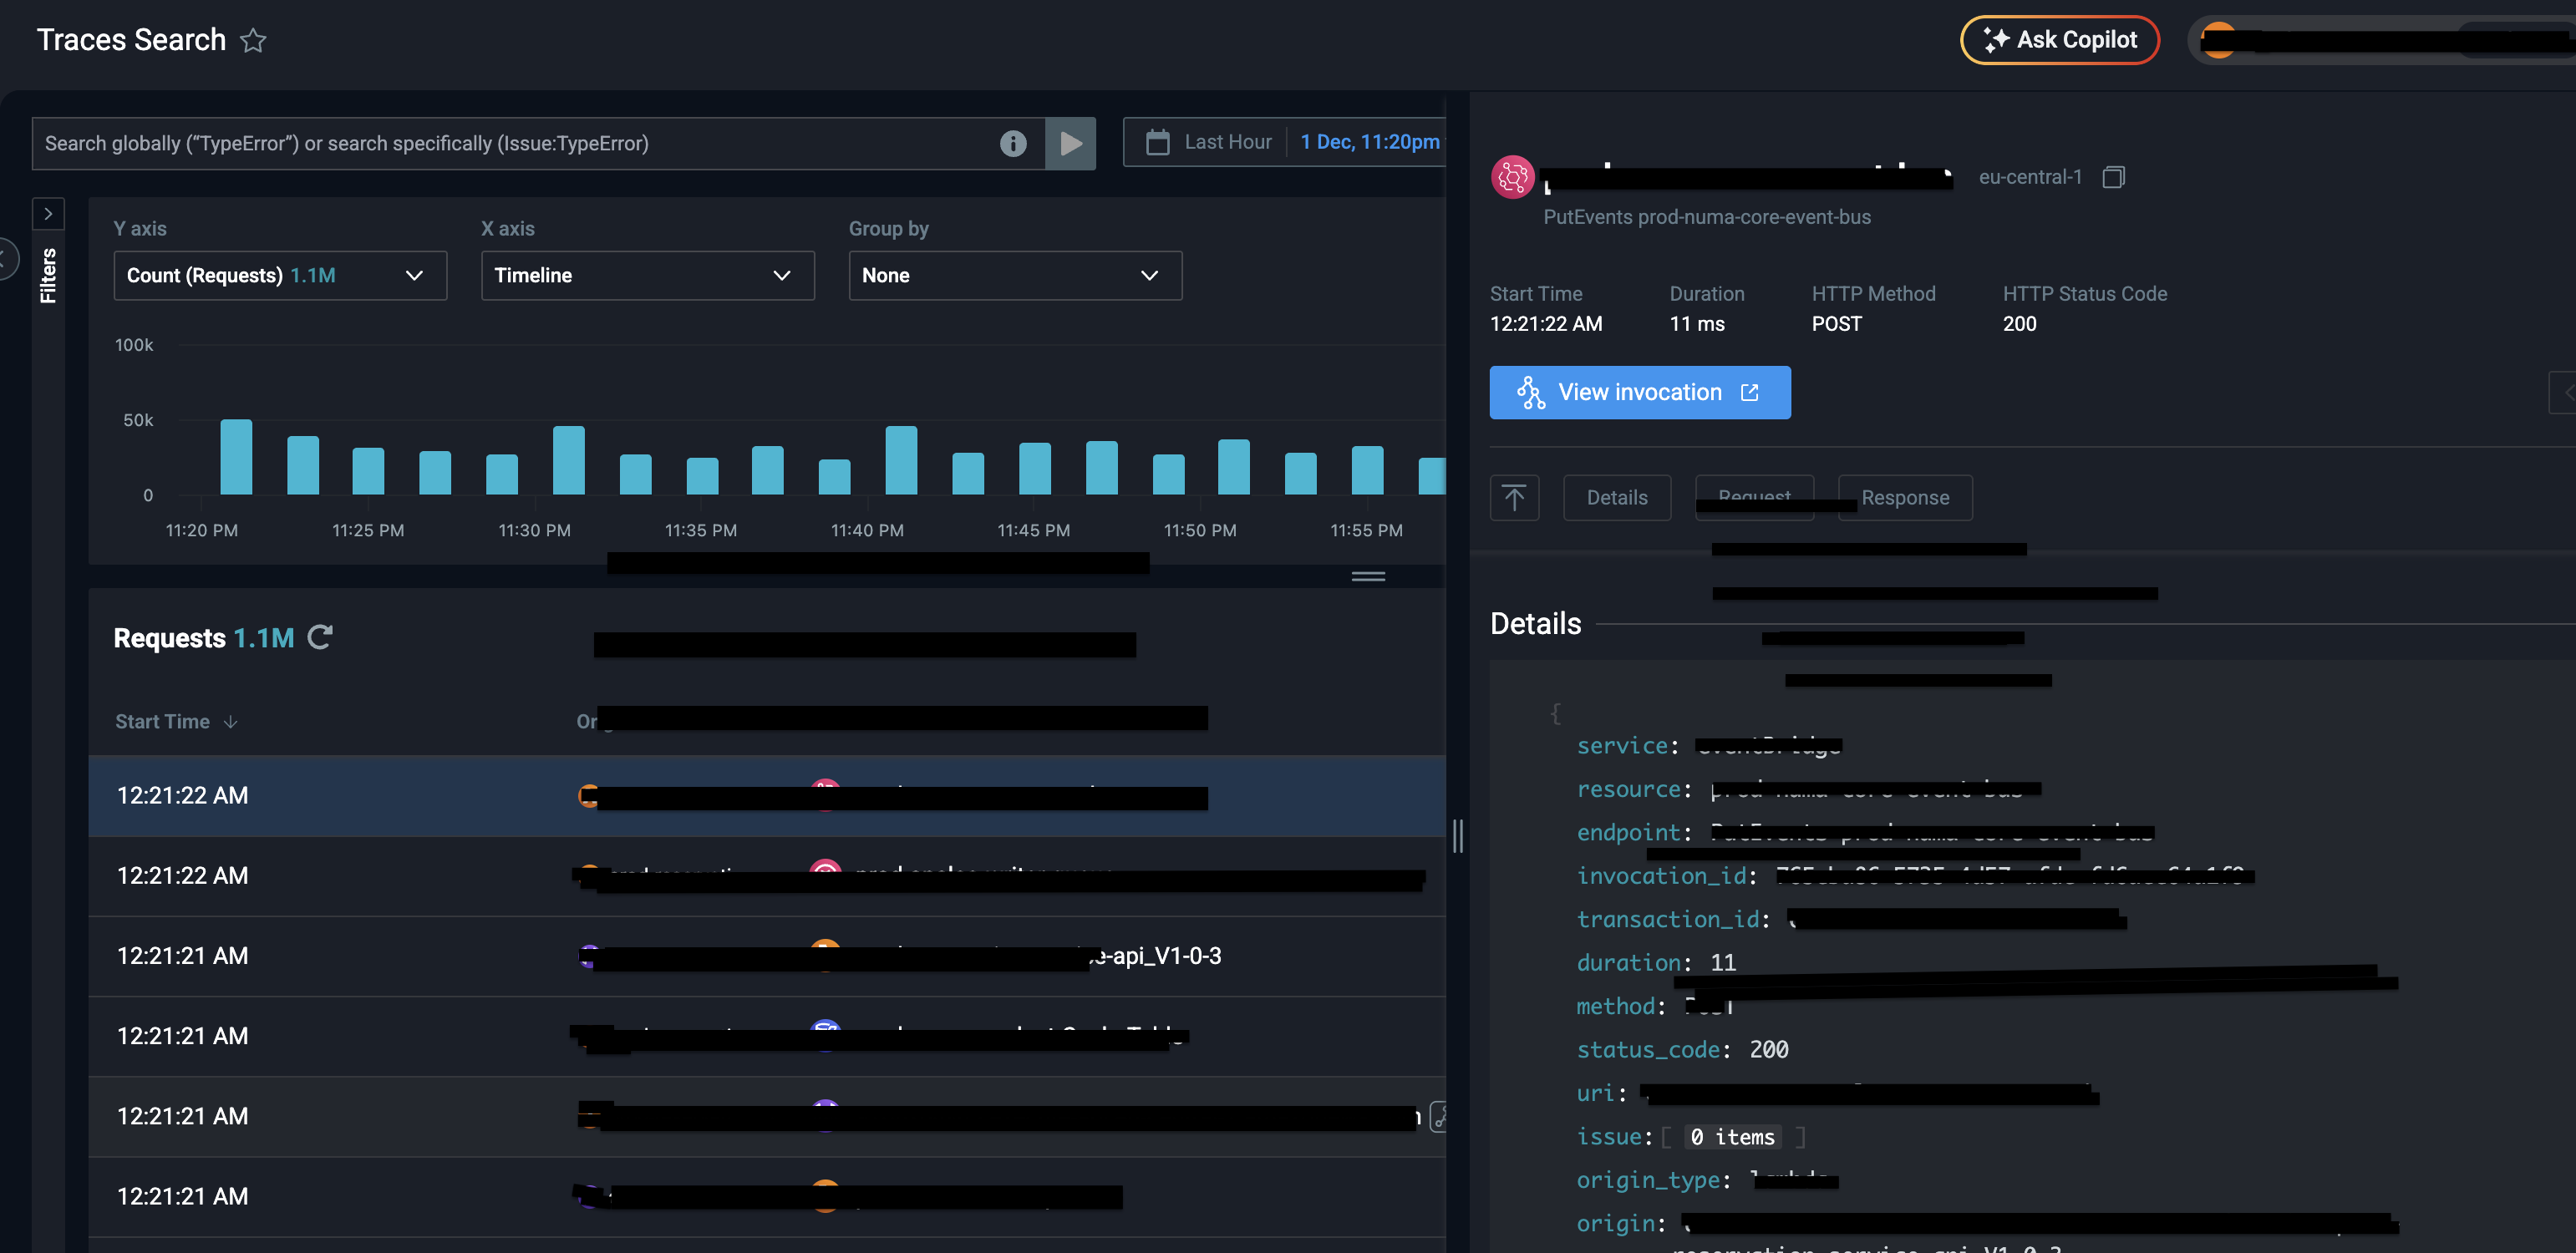
- Lumigo APM IntegrationImplemented Lumigo for comprehensive API performance tracking and distributed tracing:
- Distributed Tracing: End-to-end request tracing across microservices, enabling identification of bottlenecks in the request flow
- Endpoint Response Times: Track P50, P95, and P99 latency for every API endpoint with automatic instrumentation
- Request Rate: Monitor requests per second (RPS) per endpoint to identify high-traffic APIs
- Error Rates: Track 4xx and 5xx error rates by endpoint with detailed error context and stack traces
- Database Query Performance: Automatic correlation of slow API responses with slow database queries
- Service Dependencies: Visualize service dependencies and identify downstream bottlenecks
- Real-Time Alerts: Configure alerts for slow endpoints, high error rates, and performance degradation
- Performance OptimizationUsed APM data to drive performance optimizations:
- Slow Query Identification: Identified 12 slow database queries causing API bottlenecks
- N+1 Query Elimination: Fixed 5 endpoints with N+1 query patterns, reducing database calls by approximately 75%
- Endpoint Caching: Added caching to 6 high-traffic endpoints, improving response times by around 65%
- Database Indexing: Created 8 missing indexes based on slow query analysis
- Connection Pool Tuning: Adjusted connection pool sizes based on actual endpoint usage patterns
Additional Scaling Optimizations
Beyond the core scaling infrastructure, we implemented several additional optimizations to ensure the application could handle continued growth efficiently and cost-effectively.
- CDN for Static AssetsImplemented CloudFront CDN for static asset delivery:
- Asset Offloading: Moved images, CSS, JavaScript, and fonts to CDN, reducing application server load by 40%
- Global Distribution: CDN edge locations reduce latency for international users by 60-80%
- Caching Strategy: Configured aggressive caching for static assets with appropriate cache headers
- Cost Reduction: Reduced bandwidth costs by 55% by serving static assets from CDN instead of application servers
- Database Query OptimizationOptimized database queries to reduce load and improve response times:
- Query Analysis: Identified and optimized 15 slow queries using EXPLAIN ANALYZE and DB Query Analyser inhouse AI Solution
- Index Creation: Added 12 strategic indexes based on query patterns and access frequency
- Query Rewriting: Rewrote 8 complex queries to use more efficient join strategies
- Materialized Views: Created 3 materialized views for frequently accessed aggregated data
- Connection Pool Tuning: Optimized connection pool sizes based on actual query patterns
- Rate Limiting & ThrottlingImplemented rate limiting to prevent abuse and ensure fair resource distribution:
- API Rate Limiting: Configured rate limits per user/IP to prevent API abuse (100 requests/minute per user)
- Endpoint-Specific Limits: Applied stricter limits to expensive endpoints (e.g., search, reports)
- Graceful Degradation: Return 429 (Too Many Requests) with retry-after headers instead of errors
- Burst Allowance: Allow short bursts above the limit to handle legitimate traffic spikes
- Vertical Pod Autoscaling (VPA)Implemented VPA to optimize pod resource requests and limits:
- Resource Right-Sizing: VPA analyzes actual CPU/memory usage and recommends optimal resource requests
- Automatic Adjustment: Automatically adjusts resource requests based on historical usage patterns
- Cost Optimization: Reduced over-provisioned resources by 35%, saving $2,400/month on compute costs
- Performance Improvement: Ensured pods have adequate resources during traffic spikes, reducing OOM kills by 90%
- Load Balancer OptimizationOptimized Kubernetes ingress and load balancing configuration:
- Session Affinity: Configured session affinity for stateful endpoints to improve cache hit rates
- Health Checks: Implemented aggressive health checks to quickly remove unhealthy pods from rotation
- Connection Pooling: Optimized connection pooling at the load balancer level
- SSL/TLS Termination: Moved SSL termination to the ingress controller to reduce application server load
The Results
Six months after implementing the scaling infrastructure, the application successfully handled 3x user growth without hiring DevOps. The infrastructure automatically adapts to traffic patterns, and the engineering team can focus on building features instead of managing infrastructure.
Key Achievements
- 3x user growth handled - Scaled from 5,000 to 15,000 active users with minimal downtime. The infrastructure automatically adapts to traffic patterns, though we did experience 2 brief incidents during peak traffic that were resolved within minutes.
- Minimal downtime incidents - Only 2 minor production incidents during the 6-month scaling period, both resolved within 5-10 minutes. The high-availability architecture (read replicas, Redis cluster) helped maintain service continuity during node failures.
- ~55% cost efficiency improvement - Through intelligent autoscaling, spot instances, and resource optimization, reduced infrastructure costs by approximately 55% compared to fixed-size infrastructure, saving roughly $4,200/month.
- API response time: 450ms → 195ms - Optimized 8 slow endpoints and improved database query performance, reducing average API response time by ~57%.
- Database load reduced by ~70% - Read replica architecture and query optimization reduced primary database load significantly, largely eliminating connection pool exhaustion issues that were causing timeouts.
- Cache hit rate: 68% → 91% - Redis cluster and cache optimization improved cache hit rate by 23 percentage points, reducing database queries by ~60%.
- Automatic scaling: 6-18 nodes, 8-24 pods - Infrastructure automatically scales from baseline to peak capacity, handling traffic spikes without manual intervention.
- ~$150K saved annually - Avoided hiring a senior DevOps engineer ($150K+ annually) while achieving comparable results through specialized infrastructure expertise.
- Engineering productivity improved significantly - Engineers spend less time on infrastructure firefighting, enabling more focus on feature development. Estimated time savings of 15-20 hours per week across the team.
- Response times maintained under 250ms - During peak traffic spikes, the application maintains API response times under 250ms (P95) through intelligent autoscaling and performance optimization.
Technical Implementation
For technical teams interested in the implementation details, here's how we built the scaling infrastructure that enabled 3x user growth without hiring DevOps.
Scaling Architecture Overview
The scaling architecture is built on Kubernetes with intelligent autoscaling at multiple levels, database read replicas for query distribution, and Redis cluster for high-availability caching. All components are monitored and optimized continuously.
- Kubernetes Cluster ConfigurationEKS cluster with Karpenter for node autoscaling, configured with:
- Node Groups: Mixed instance types (spot and on-demand) for cost optimization
- Pod Disruption Budgets: Ensured high availability during node replacements
- Resource Quotas: Namespace-level quotas to prevent resource exhaustion
- Network Policies: Secure pod-to-pod communication
- Monitoring & ObservabilityComprehensive monitoring stack for scaling decisions:
- Prometheus: Metrics collection from all services and infrastructure
- Grafana: Dashboards for cluster metrics, application performance, and database health
- APM Integration: Endpoint-level performance tracking for optimization
- Alerting: Proactive alerts for scaling events and performance degradation
Lessons Learned
Key Insights
- Autoscaling is essential for growth: Fixed-size infrastructure can't handle unpredictable traffic patterns. Intelligent autoscaling (Karpenter + HPA) enables infrastructure to adapt automatically to demand.
- Database read replicas eliminate bottlenecks: A single database becomes a bottleneck at scale. Read replicas distribute query load and prevent connection pool exhaustion.
- High-availability caching is critical: Redis cluster provides horizontal scaling and automatic failover, ensuring cache availability even during node failures.
- APM enables data-driven optimization: Without visibility into API performance, optimization is guesswork. APM provides the data needed to identify and fix bottlenecks systematically.
- Cost optimization through intelligent scaling: Autoscaling with spot instances and resource optimization can reduce infrastructure costs by 50-60% while improving performance.
- Specialized expertise beats generalist hiring: Instead of hiring a generalist DevOps engineer, specialized infrastructure expertise delivers better results at a fraction of the cost.
Ready to Scale Without Hiring DevOps?
Get a free infrastructure audit and discover how much you could save. We'll analyze your setup and provide a detailed optimization roadmap for scaling your infrastructure intelligently.