The Challenge
A B2B SaaS startup was experiencing production outages every week, with the engineering team spending 40% of their time firefighting infrastructure issues instead of building features. For teams struggling with reliability issues, process improvements are critical. See our high availability guides for database reliability. The application lacked comprehensive monitoring - when something broke, engineers had no way to understand what was happening. Alerts were either missing entirely or generating excessive noise (approximately 195 alerts per week, with 180+ being false positives or noise). Deployments were manual and error-prone, taking 45 minutes and frequently causing incidents. Critical issues like database connection failures, disk space exhaustion, and pod crashes were only discovered when customers reported problems - by then, it was too late.
Note: All screenshots in this case study have been anonymized. Application names, pod names, and service identifiers have been redacted to protect client confidentiality.
Comprehensive Application Monitoring
The application had no visibility into its runtime behavior. When issues occurred, engineers were flying blind - no metrics, no logs, no way to understand what was happening. We implemented a complete observability stack that provides real-time insights into application performance, error rates, and user experience metrics.
- Application Metrics & TracingIntegrated Prometheus and Grafana for application-level metrics collection. Implemented distributed tracing to track requests across microservices, enabling rapid identification of performance bottlenecks and error sources. Added custom metrics for business logic, API response times, and error rates. This foundation enabled us to move from reactive troubleshooting to proactive issue prevention.
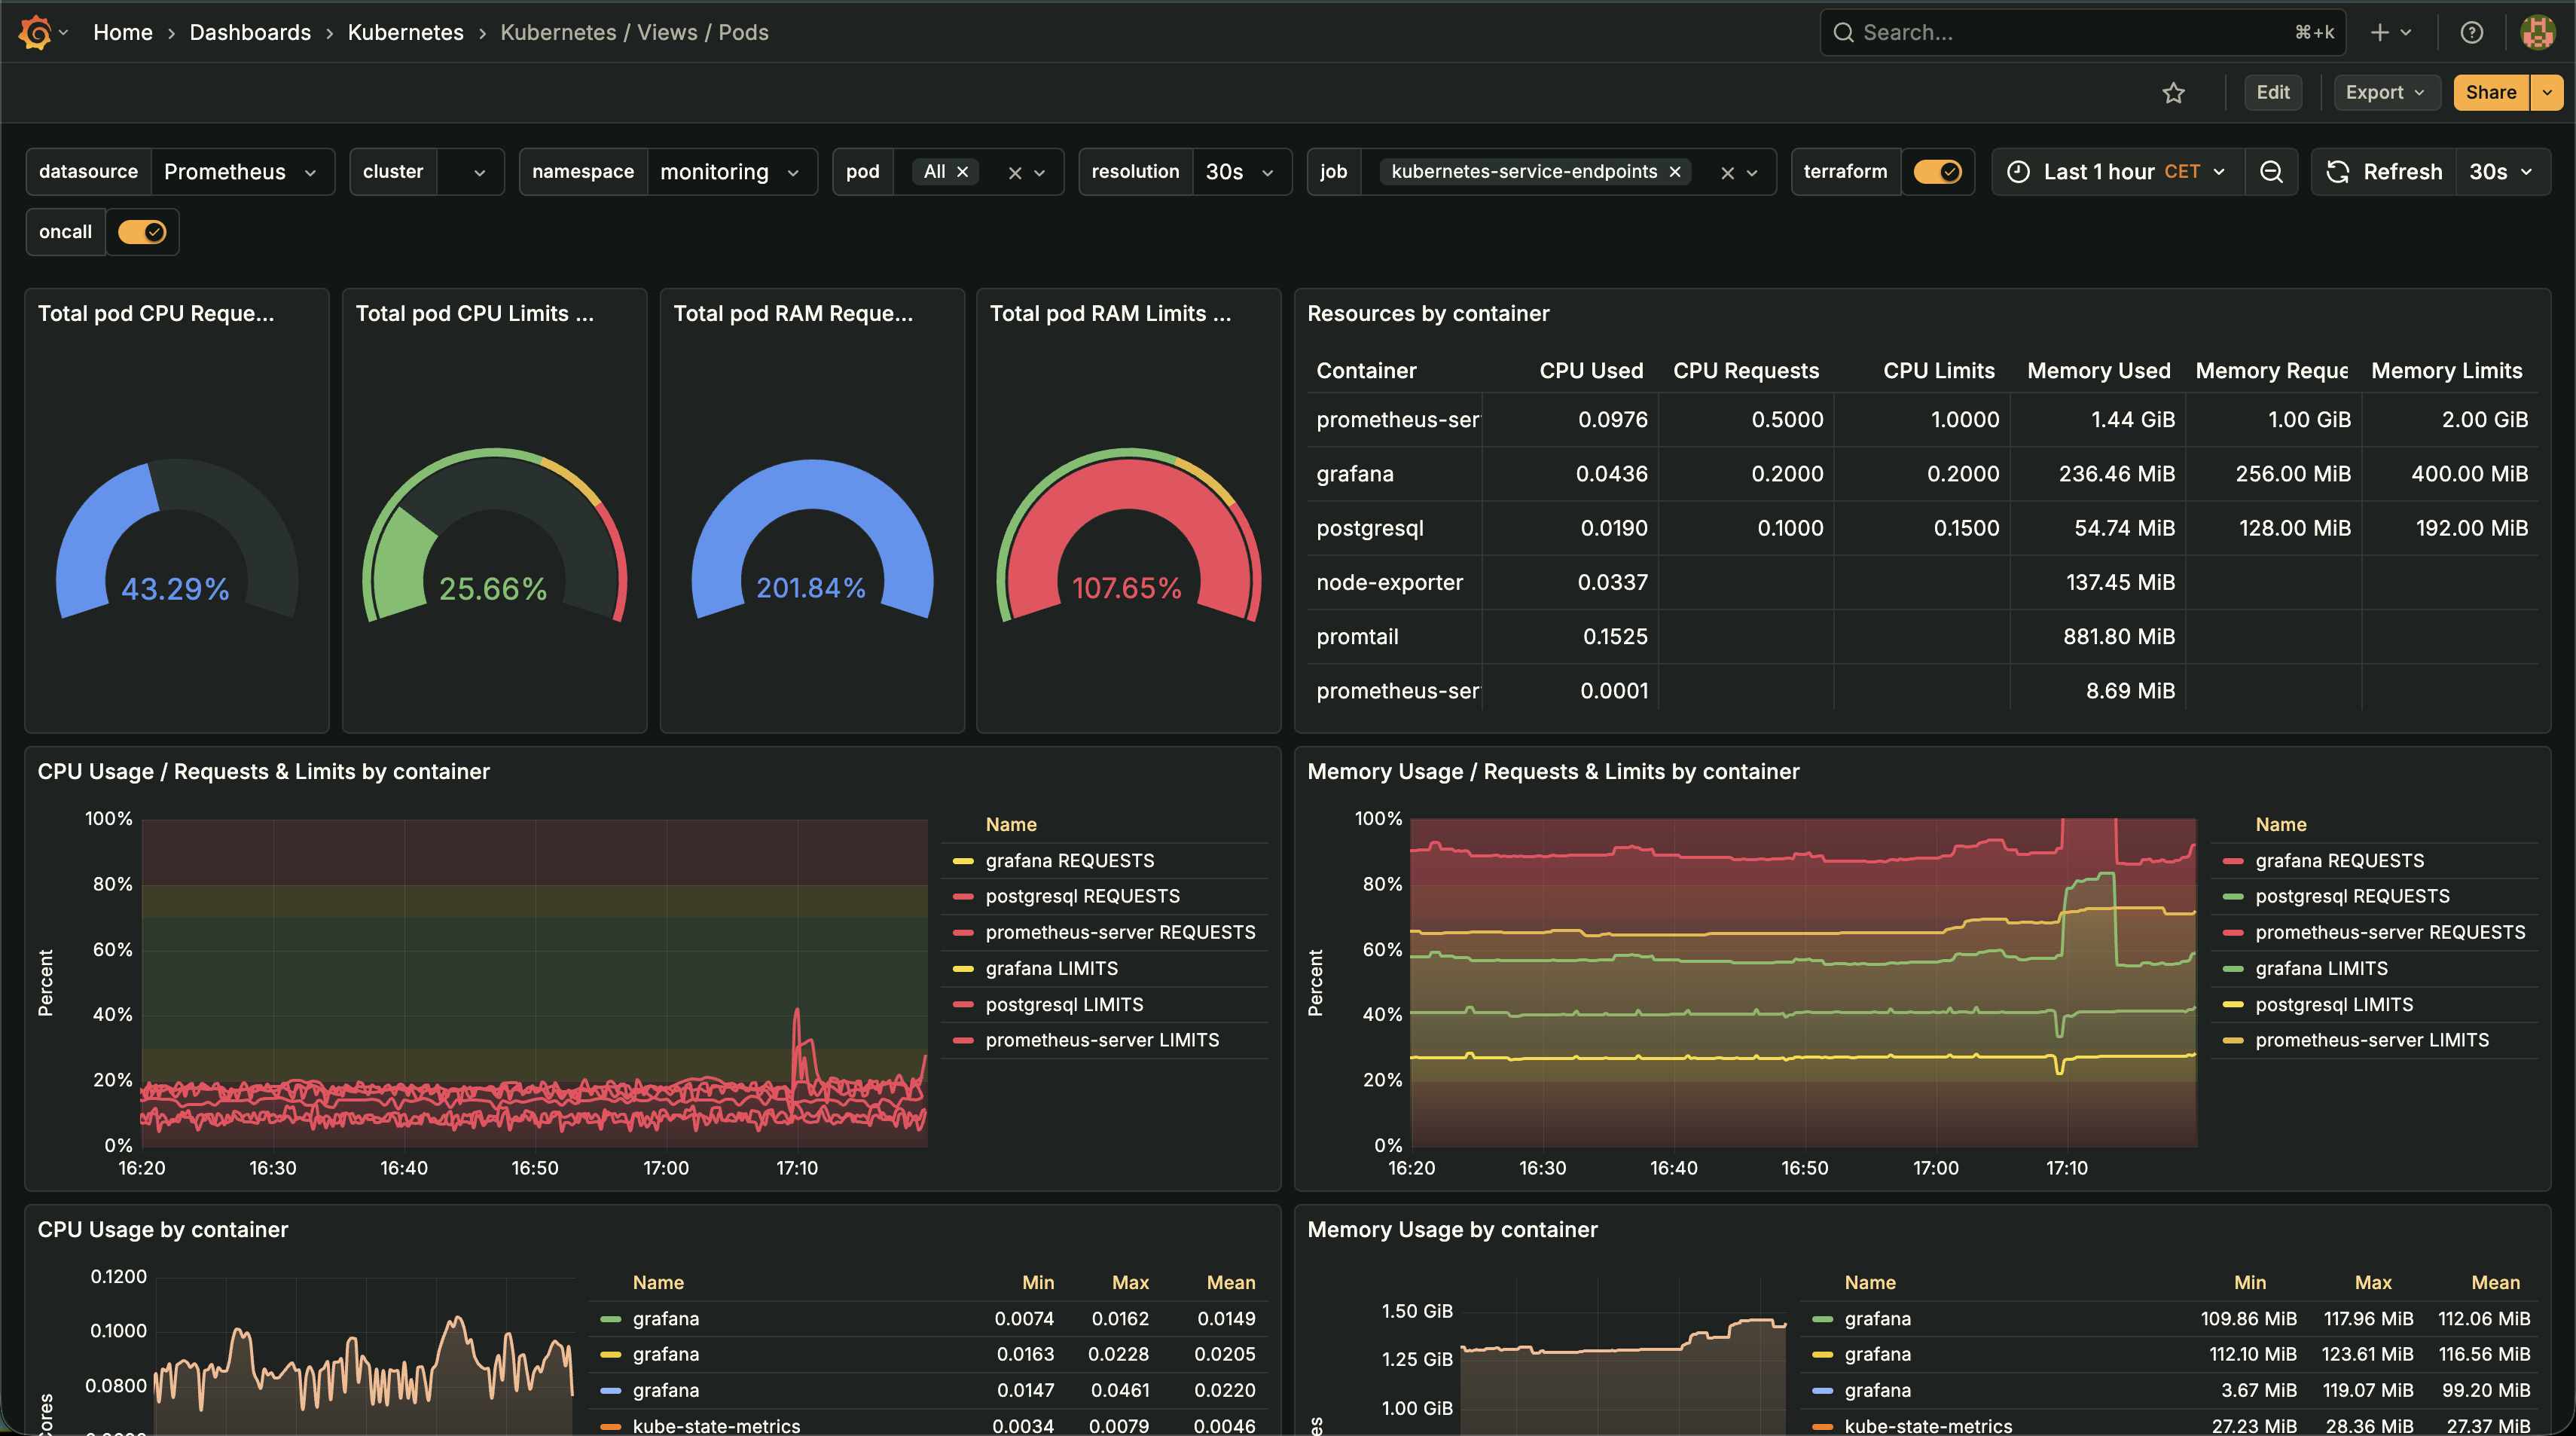
- Real-Time DashboardsCreated comprehensive Grafana dashboards for application health, API performance, database query performance, and user activity patterns. Dashboards provide instant visibility into system state, enabling proactive issue detection before they impact users. The engineering team can now see the health of every service at a glance, with drill-down capabilities for detailed investigation.
- Log Aggregation & AnalysisImplemented centralized logging with Promtail and Loki, enabling fast log searches and correlation across services. Configured log retention policies and automated log analysis to identify patterns and anomalies.
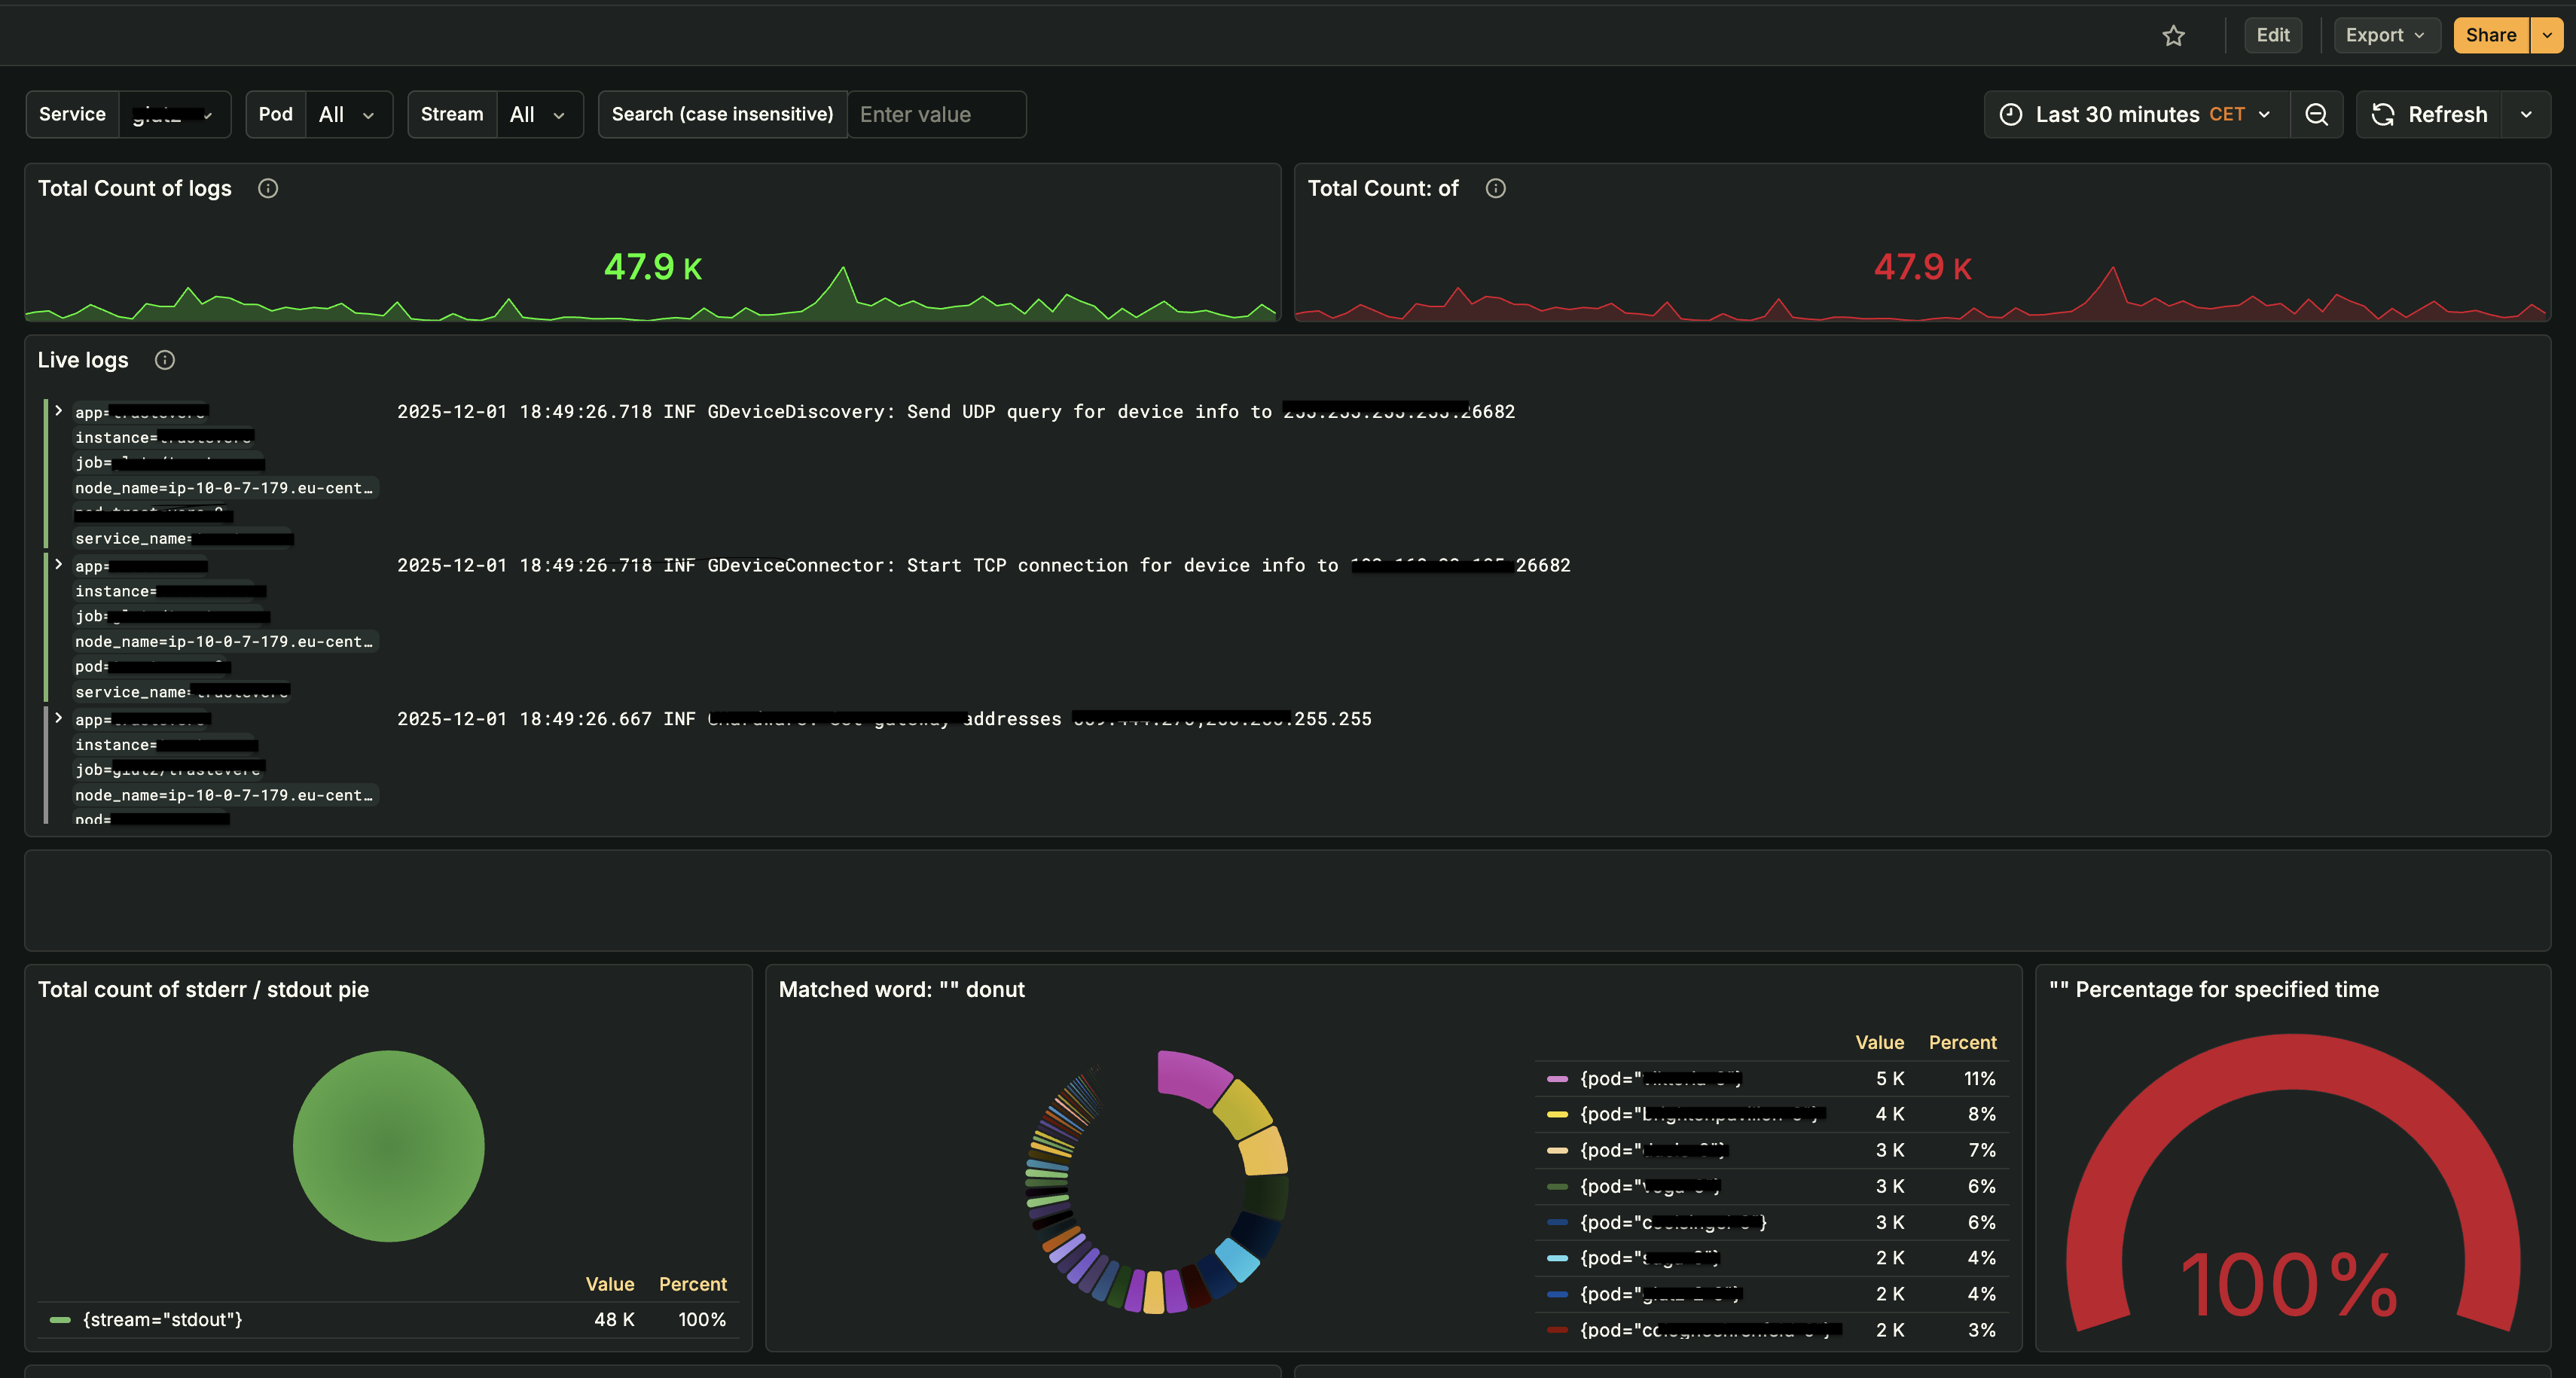 Grafana Logs Dashboard: Live log streaming, total log counts, pod distribution analysis, and real-time log search capabilities (application names redacted for privacy)The centralized logging system provides:
- Real-Time Log Streaming: Live log entries with structured metadata (app, instance, pod, service) for instant troubleshooting
- Log Count Analytics: Time-series analysis of log volumes to identify anomalies and traffic patterns
- Pod-Level Distribution: Breakdown of logs by pod/service to quickly identify problematic components
- Stream Analysis: Separation of stdout/stderr streams for focused debugging
- Fast Search: Case-insensitive log search with filtering by service, pod, and time range
- Pattern Detection: Automated analysis to identify error patterns and anomalies across services
Operations Infrastructure Monitoring
Critical infrastructure components like PostgreSQL and Redis were running without proper monitoring. Database connection failures and cache issues were only discovered when customers reported problems. We implemented detailed monitoring for all operational services, enabling proactive issue detection and performance optimization. This visibility transformed how we managed infrastructure - from reactive firefighting to proactive optimization.
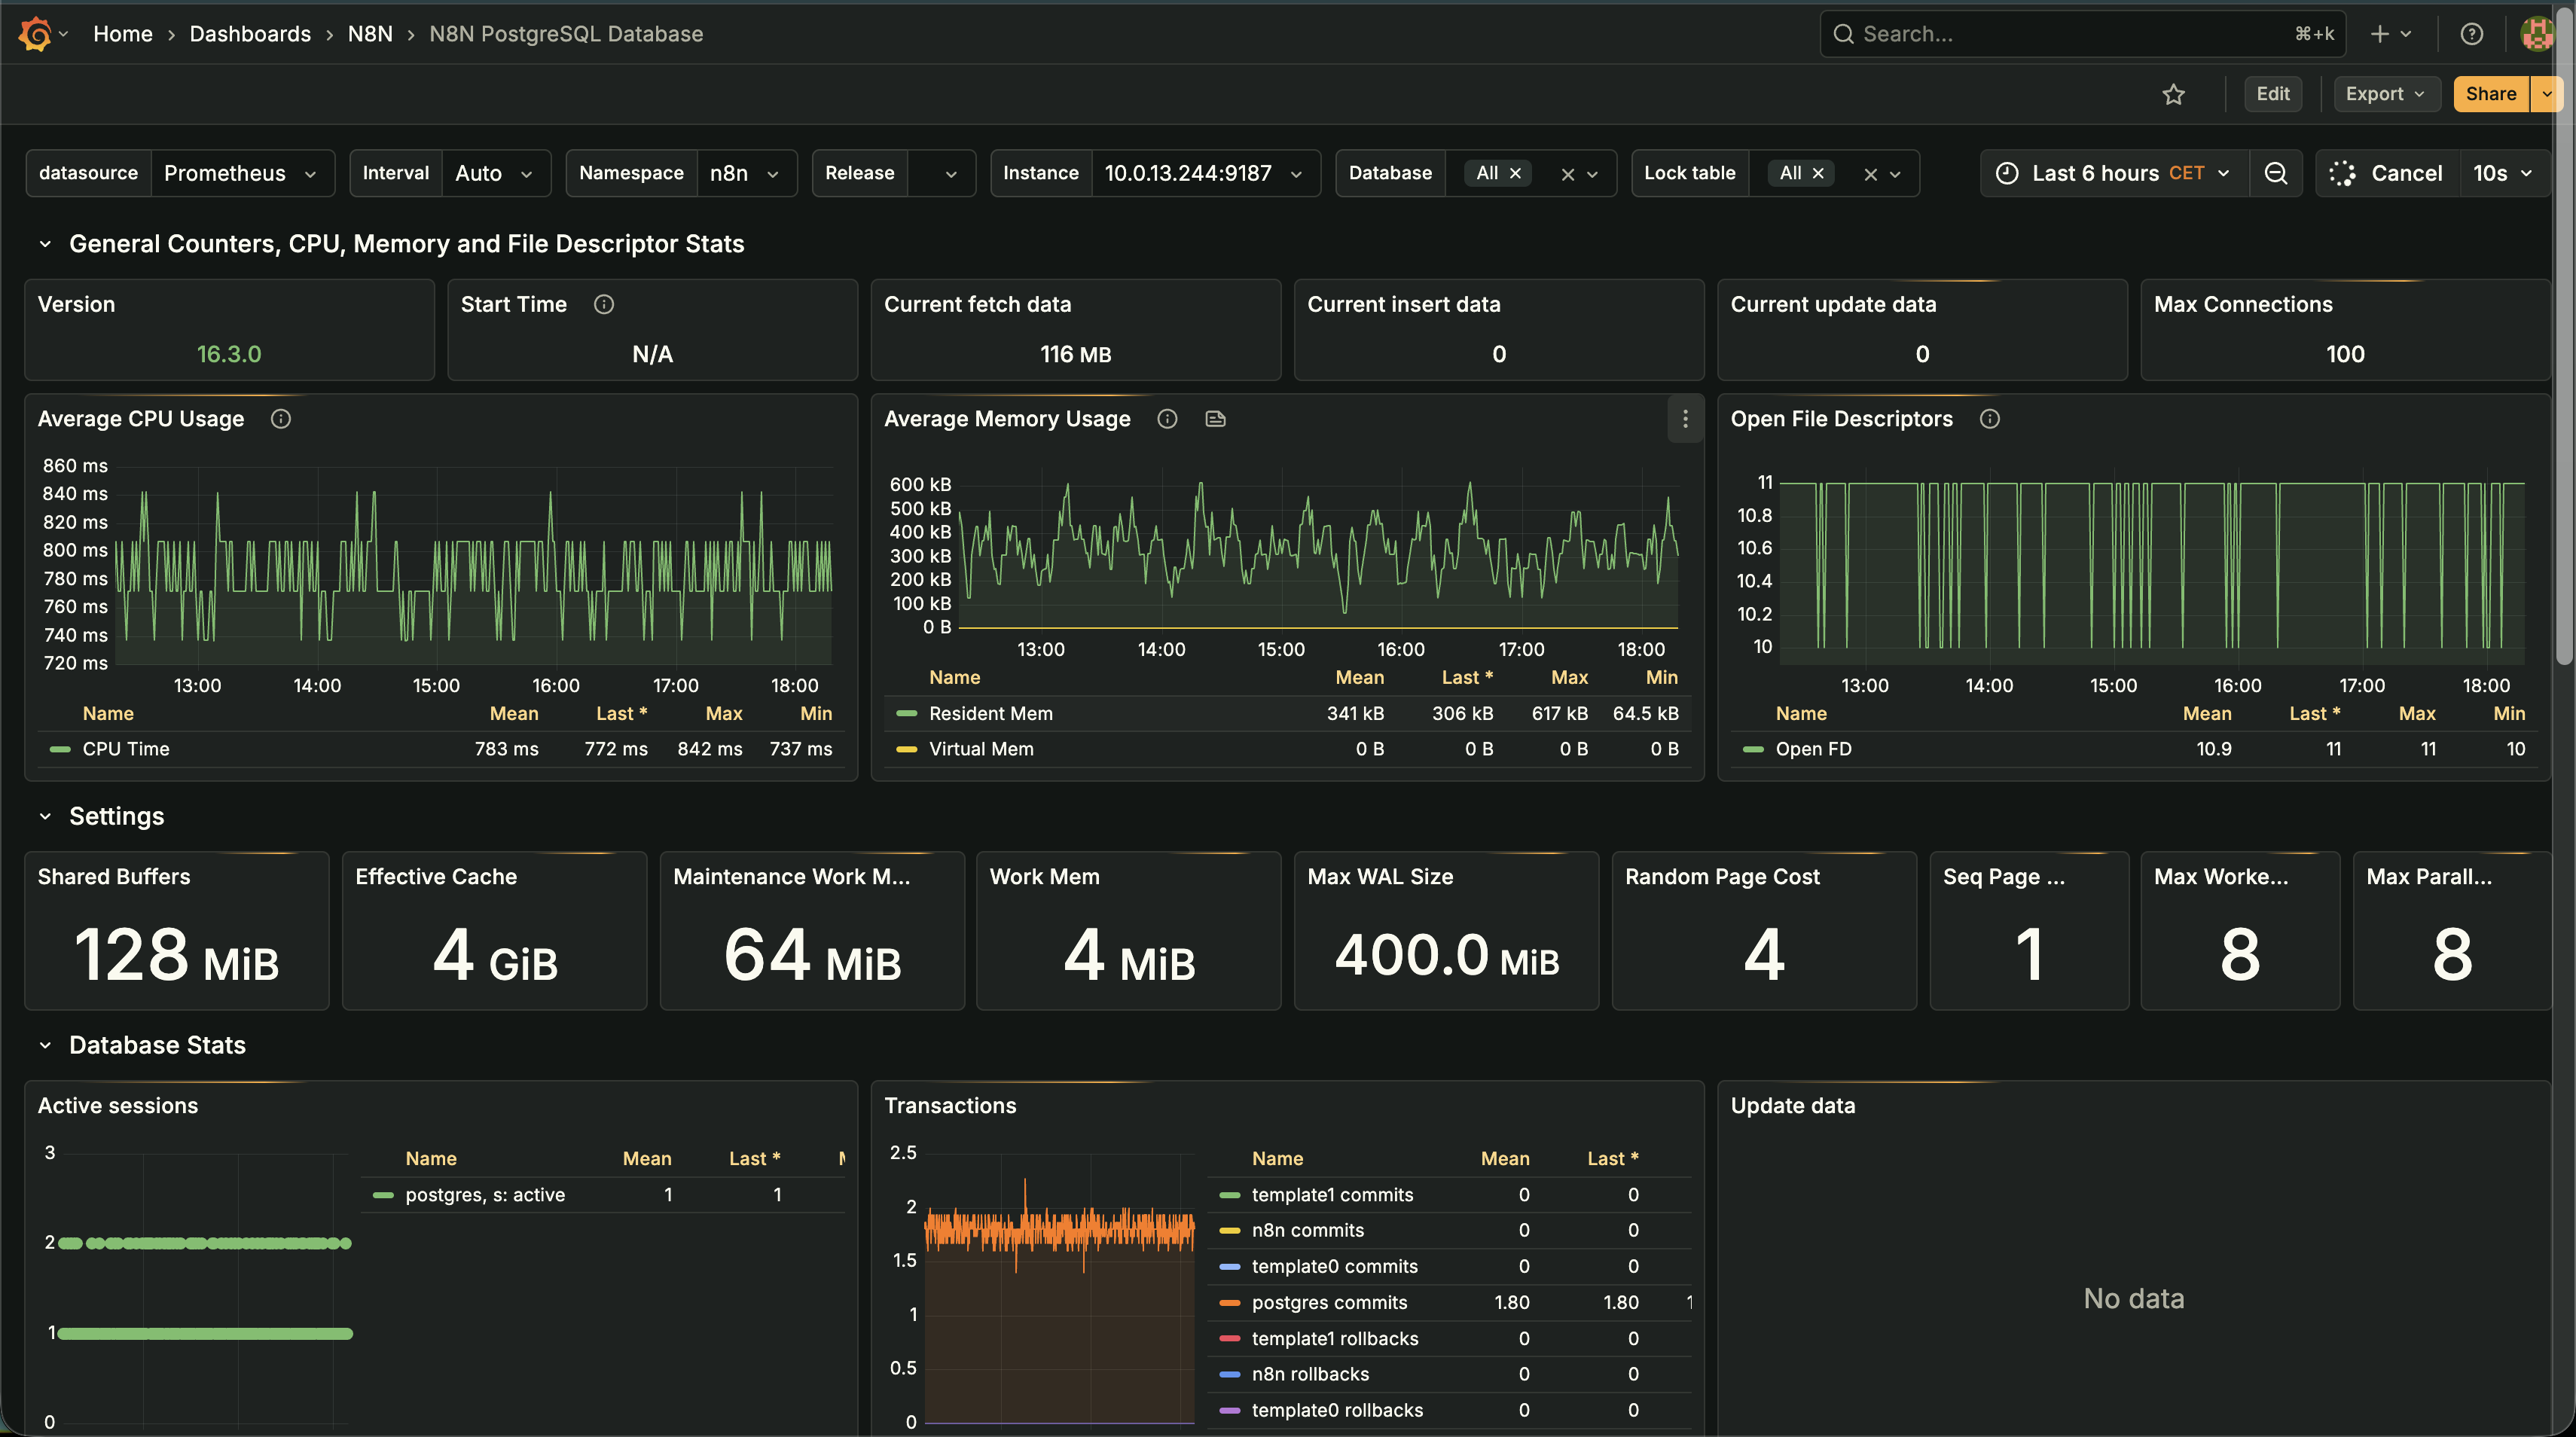
- PostgreSQL Database MonitoringThe database was a black box - no visibility into connection pools, query performance, or resource utilization. We deployed PostgreSQL Exporter and created comprehensive Grafana dashboards tracking:
- Performance Metrics: CPU usage, memory consumption, file descriptor usage, and query performance
- Connection Management: Active sessions, connection pool utilization, and connection limits
- Database Health: Transaction rates, commit/rollback statistics, and database size trends
- Configuration Monitoring: Shared buffers, effective cache size, work memory, and WAL settings
- Replication Status: Lag monitoring, replication slot status, and backup verification
- Redis Cache MonitoringImplemented Redis Exporter with detailed monitoring for:
- Memory Usage: Real-time memory consumption, eviction policies, and memory fragmentation
- Performance Metrics: Command latency, operations per second, and hit/miss ratios
- Replication Status: Master-slave replication lag and sync status
- Key Space Analysis: Database size, key expiration patterns, and memory efficiency
- Client Connections: Active client count, connection pool utilization, and connection limits
- Network I/O: Input/output traffic patterns and bandwidth utilization
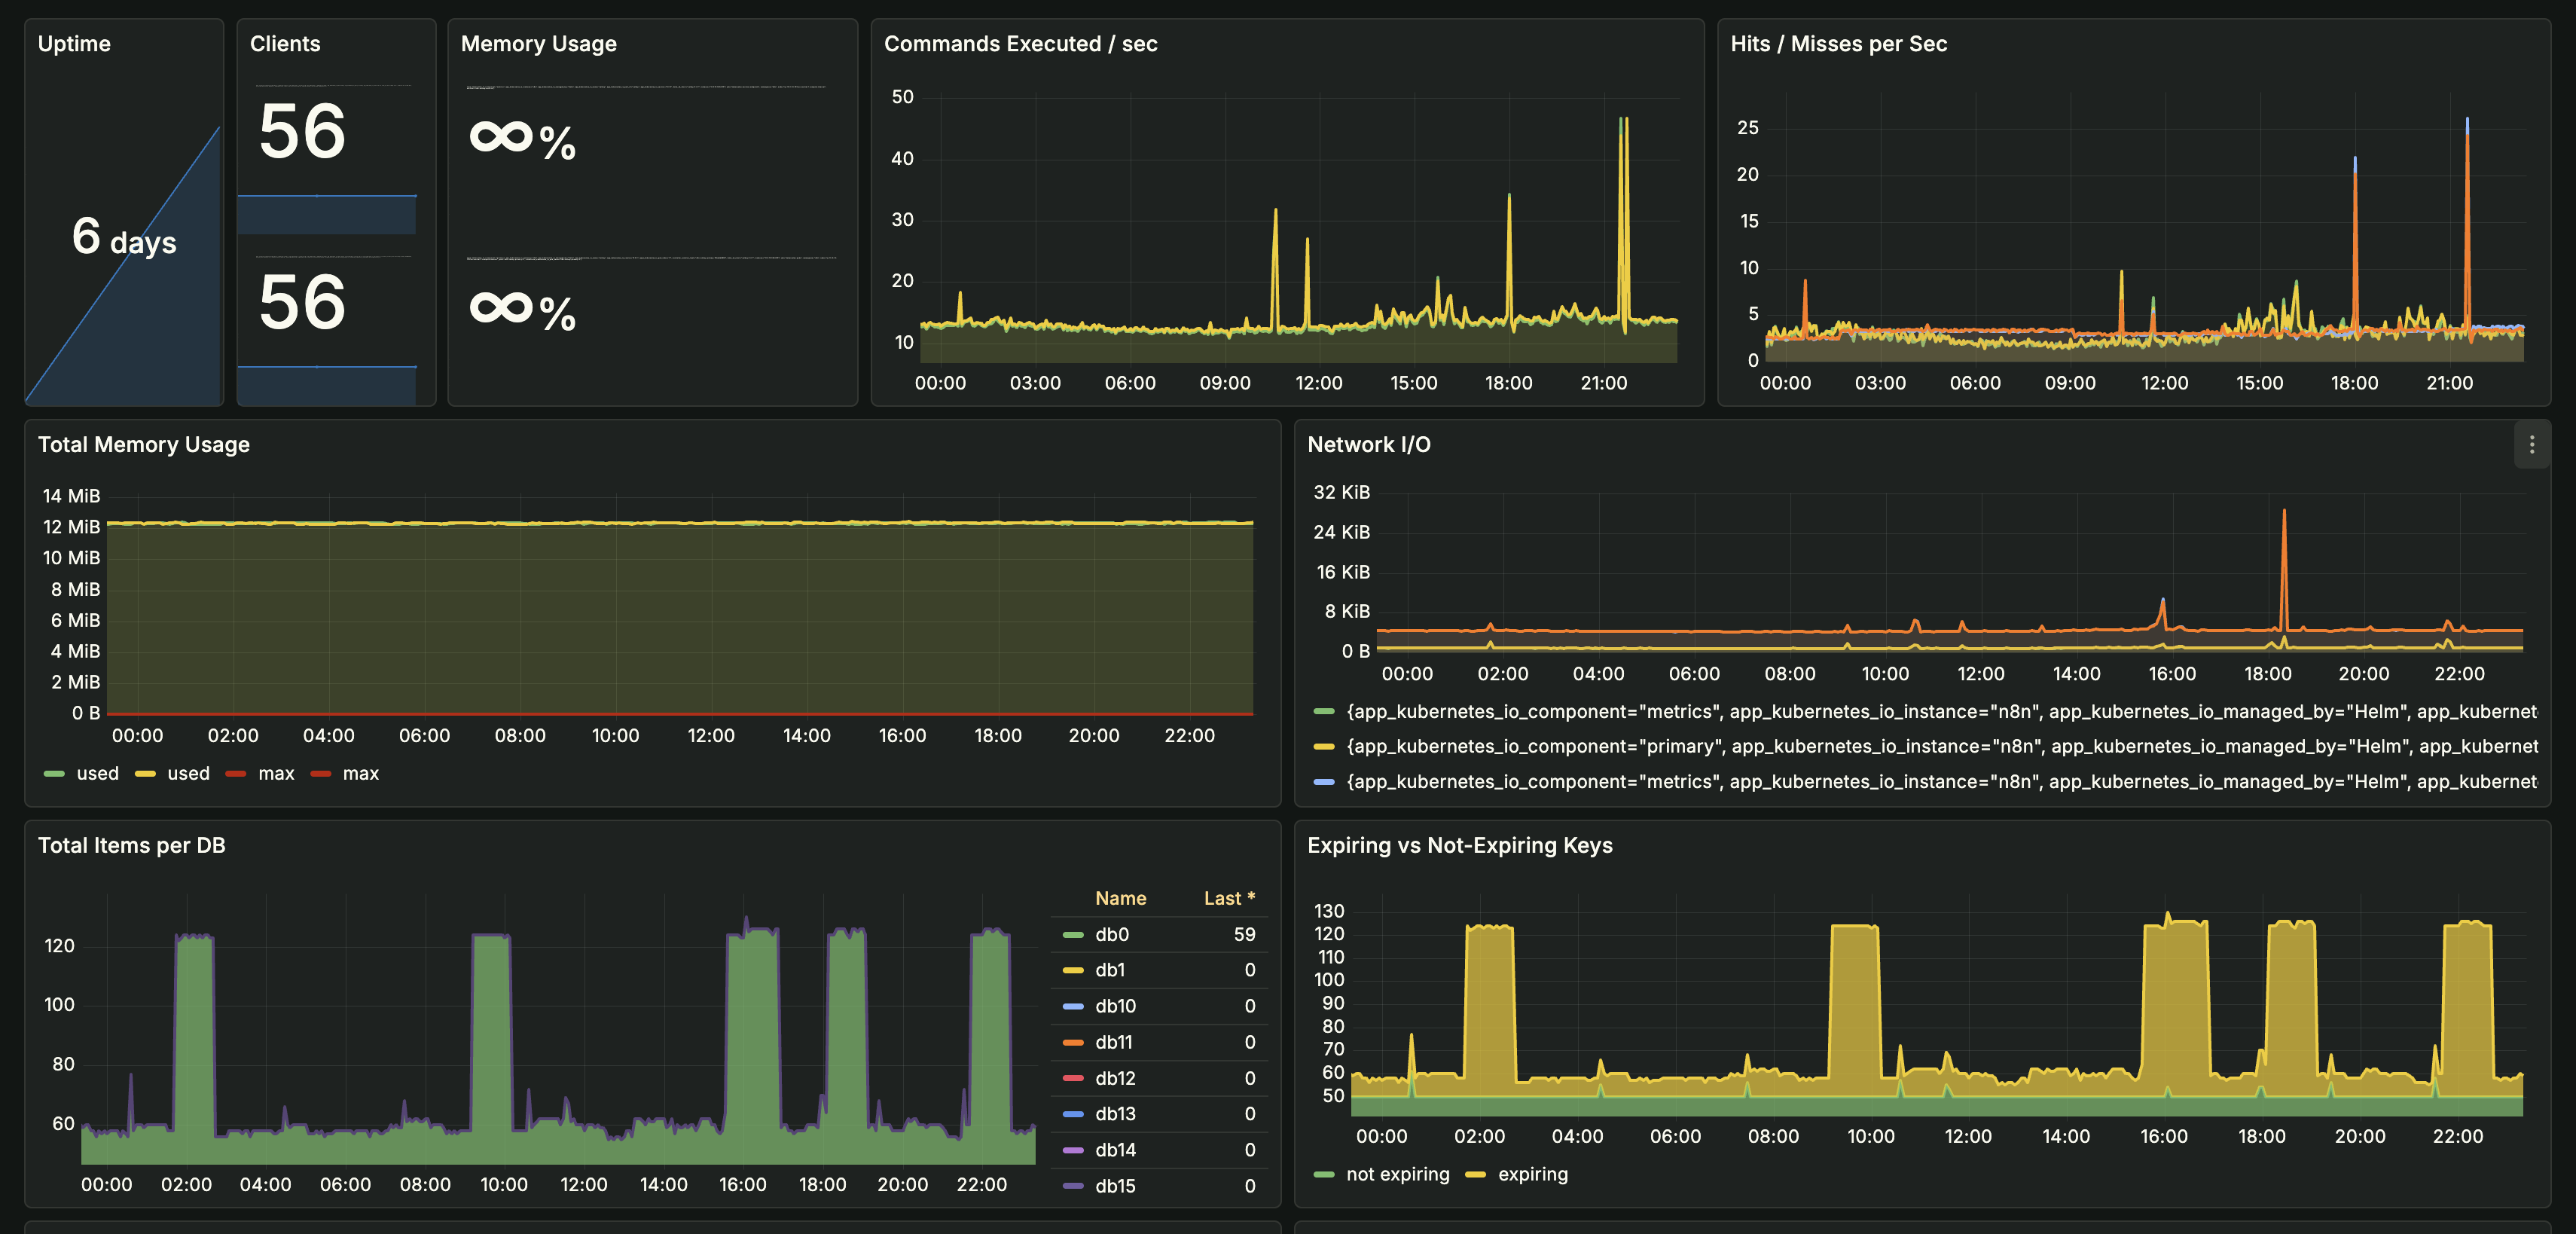 Redis Monitoring Dashboard: Comprehensive metrics for uptime, client connections, memory usage, command execution rates, cache hit/miss ratios, network I/O, and key space analysis (application names redacted for privacy)Issues Identified & Resolved:
- Memory Pressure: Discovered memory usage reporting anomalies and memory fragmentation issues. Implemented proper memory limits and optimized eviction policies (allkeys-lru) to prevent OOM conditions.
- Low Cache Hit Rates: Initial cache hit rate was only 65%, indicating inefficient caching strategies. Analyzed key expiration patterns and identified that most keys were expiring too quickly. Adjusted TTL values and implemented cache warming strategies, improving hit rate to 92%.
- Memory Leaks: Found keys accumulating in databases without proper expiration. Implemented automated key cleanup jobs and set appropriate TTLs for all cache entries, reducing memory usage by 40%.
- Connection Pool Exhaustion: Monitored client connection counts and identified connection leaks. Fixed application connection handling and implemented proper connection pooling, preventing connection-related failures.
- Network I/O Bottlenecks: Identified spikes in network traffic during peak hours. Optimized data serialization and implemented compression for large cache values, reducing network bandwidth by 35%.
- Database Imbalance: Found uneven key distribution across Redis databases (db0-db15). Rebalanced keys across databases and implemented sharding strategies for better memory utilization.
- Kubernetes Infrastructure MonitoringEnhanced existing Kubernetes monitoring with additional metrics for:
- Pod Health: Restart counts, crash loop detection, and resource utilization
- Service Discovery: Endpoint availability and service mesh metrics
- Storage: Persistent volume usage, storage class performance, and backup status
- Network: Ingress/egress traffic patterns, latency, and error rates
Intelligent Alerting System
The previous alerting setup was a disaster - approximately 195 alerts per week, with 180+ being false positives, duplicate alerts, or non-actionable noise. Engineers had learned to ignore alerts because they were rarely meaningful. We replaced this with a carefully designed alerting strategy that only notifies the team when action is required. Reduced alert volume from 195 per week to 15 actionable notifications per week (92% reduction) while ensuring critical issues are caught immediately. Now, when an alert fires, engineers know it's real and requires attention.
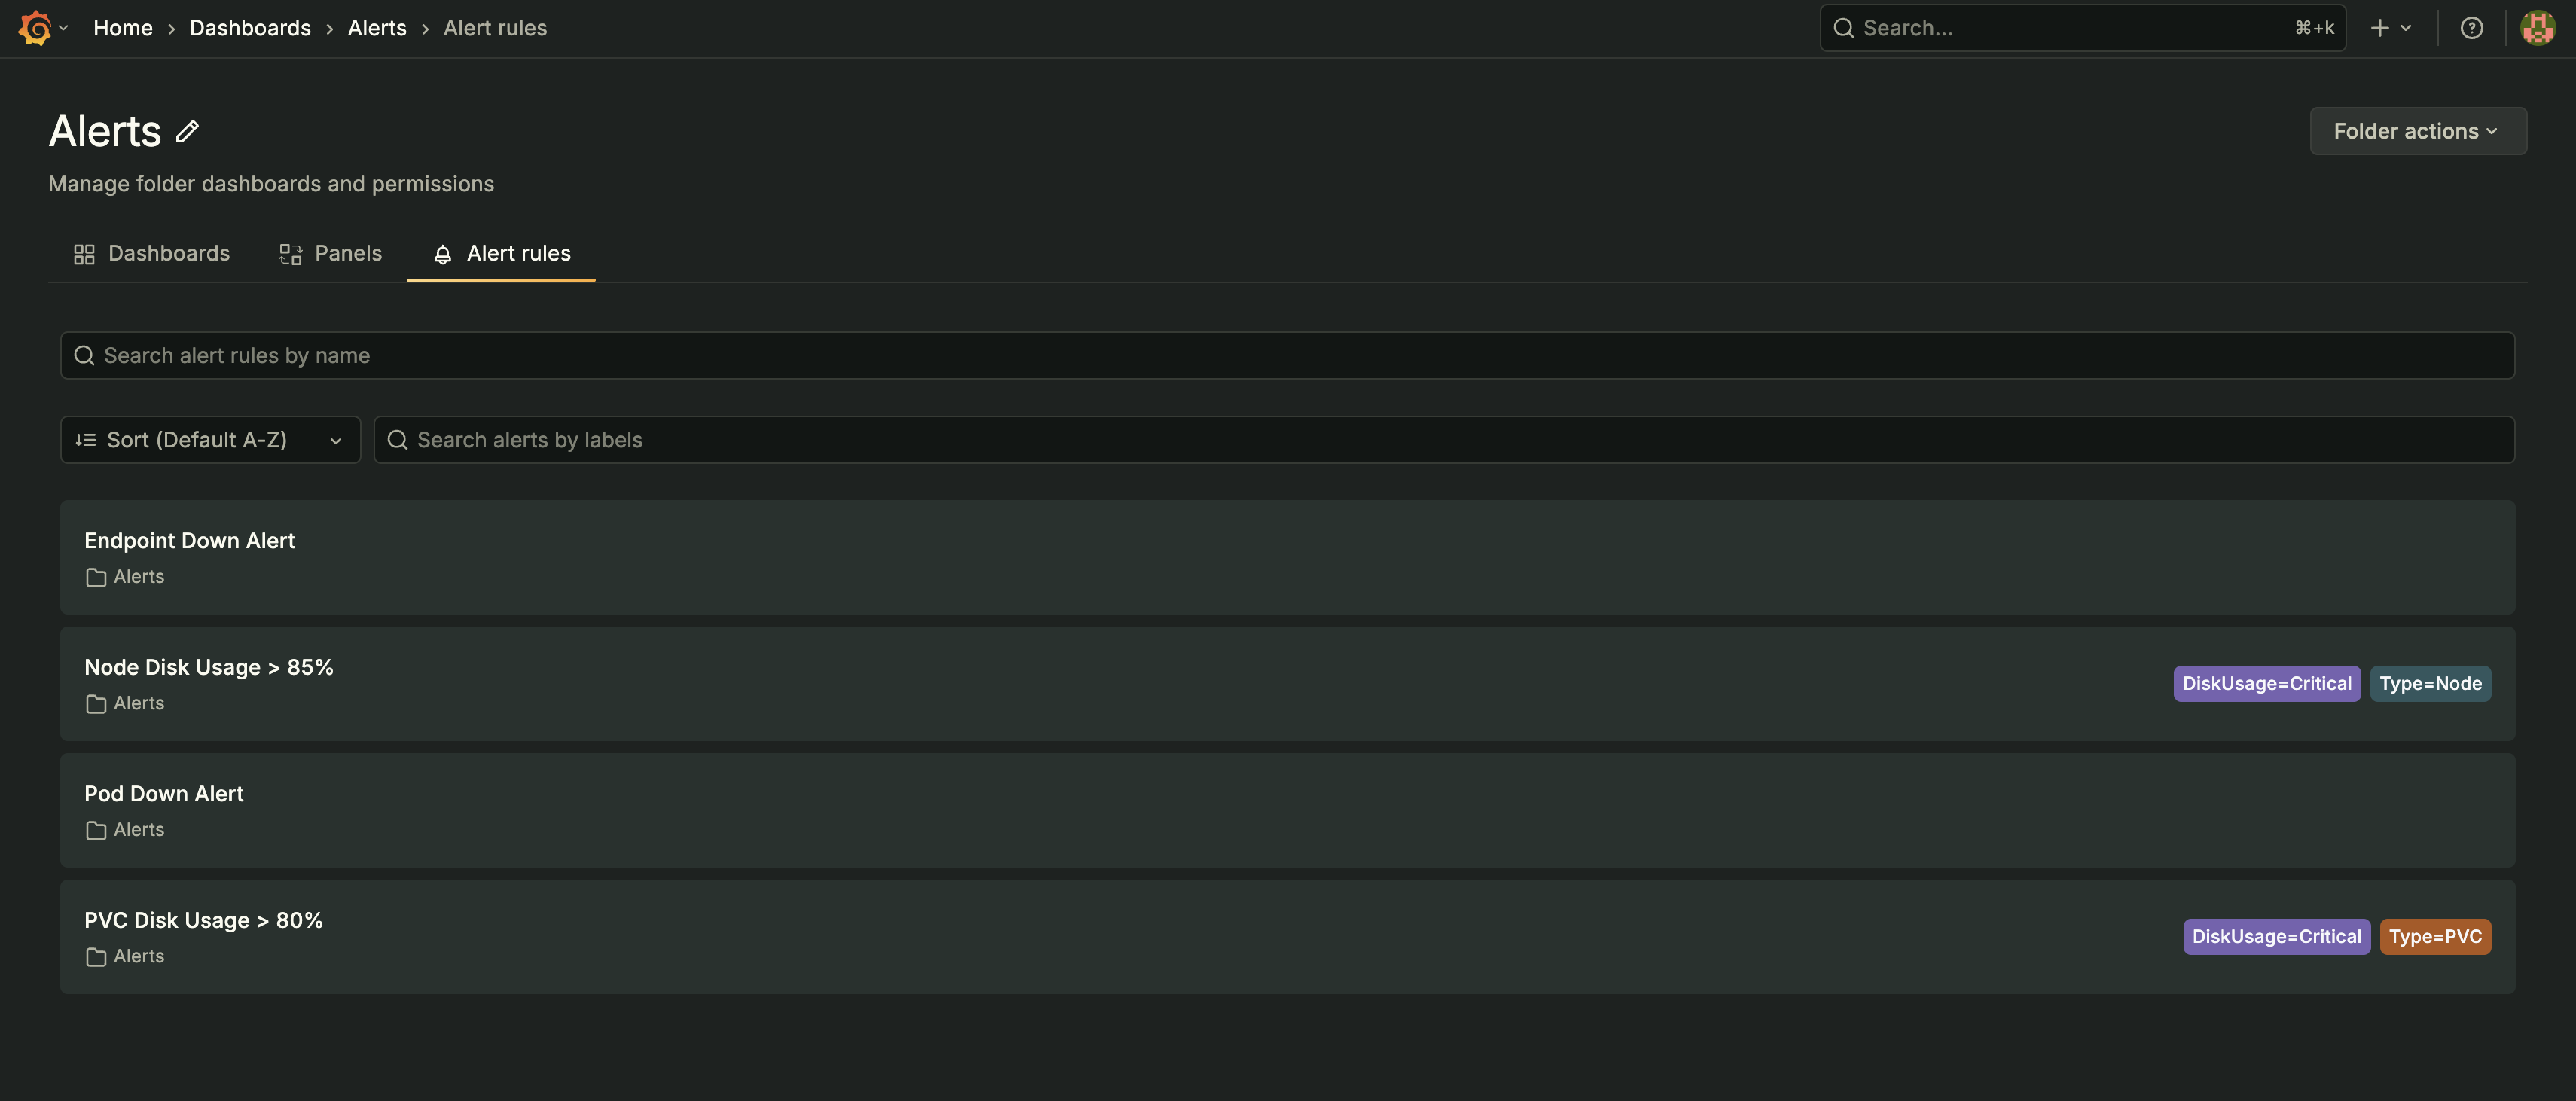
- Disk Usage AlertsImplemented multi-tier disk usage alerts to prevent storage-related outages:
- Warning (75%): Early notification for capacity planning
- Critical (85%): Immediate escalation with automated cleanup scripts
- Emergency (95%): Page on-call engineer with auto-scaling triggers
- Pod Down & Health AlertsCreated comprehensive pod health monitoring with alerts for:
- Pod Crash Loops: Detects pods restarting repeatedly, indicating application errors
- Pod Not Ready: Alerts when pods fail readiness probes for extended periods
- Resource Exhaustion: Monitors CPU and memory limits, alerting before OOM kills
- Deployment Failures: Tracks failed deployments and rollback triggers
- Application Endpoint MonitoringImplemented endpoint health checks and availability monitoring:
- Endpoint Down Alerts: Monitors critical API endpoints, alerting on HTTP errors or timeouts
- Response Time Alerts: Tracks P95/P99 latency, alerting when thresholds are exceeded
- Error Rate Monitoring: Alerts when error rates exceed acceptable thresholds (5xx errors)
- Health Check Failures: Monitors application health endpoints and dependency status
- Alert Routing & EscalationImplemented intelligent alert routing to reduce noise:
- Alert Grouping: Related alerts are grouped to prevent alert storms
- Deduplication: Prevents duplicate alerts for the same issue
- Severity Levels: Critical alerts page on-call, warnings go to Slack
- Runbook Integration: Each alert includes links to runbooks and troubleshooting guides
- Auto-Resolution: Alerts automatically resolve when conditions normalize
Automated CI/CD Pipeline
Deployments were a nightmare - 45 minutes of manual steps, copy-pasting commands, and crossing fingers. Human error caused multiple production incidents. We replaced this with a fully automated CI/CD pipeline using GitHub Actions for continuous integration and ArgoCD for continuous deployment. Reduced deployment time from 45 minutes to 6 minutes while eliminating human error. Deployments went from a stressful, error-prone process to a reliable, one-click operation.
- GitHub Actions CI PipelineBuilt comprehensive CI pipeline with automated quality gates:
- Code Quality: Automated linting, formatting checks, and security scanning
- Testing: Unit tests, integration tests, and end-to-end tests run on every PR
- Build & Package: Automated Docker image builds with multi-stage optimization
- Security Scanning: Container vulnerability scanning and dependency checks
- Performance Testing: Load testing for critical endpoints before deployment
- Artifact Management: Versioned artifacts stored in container registry
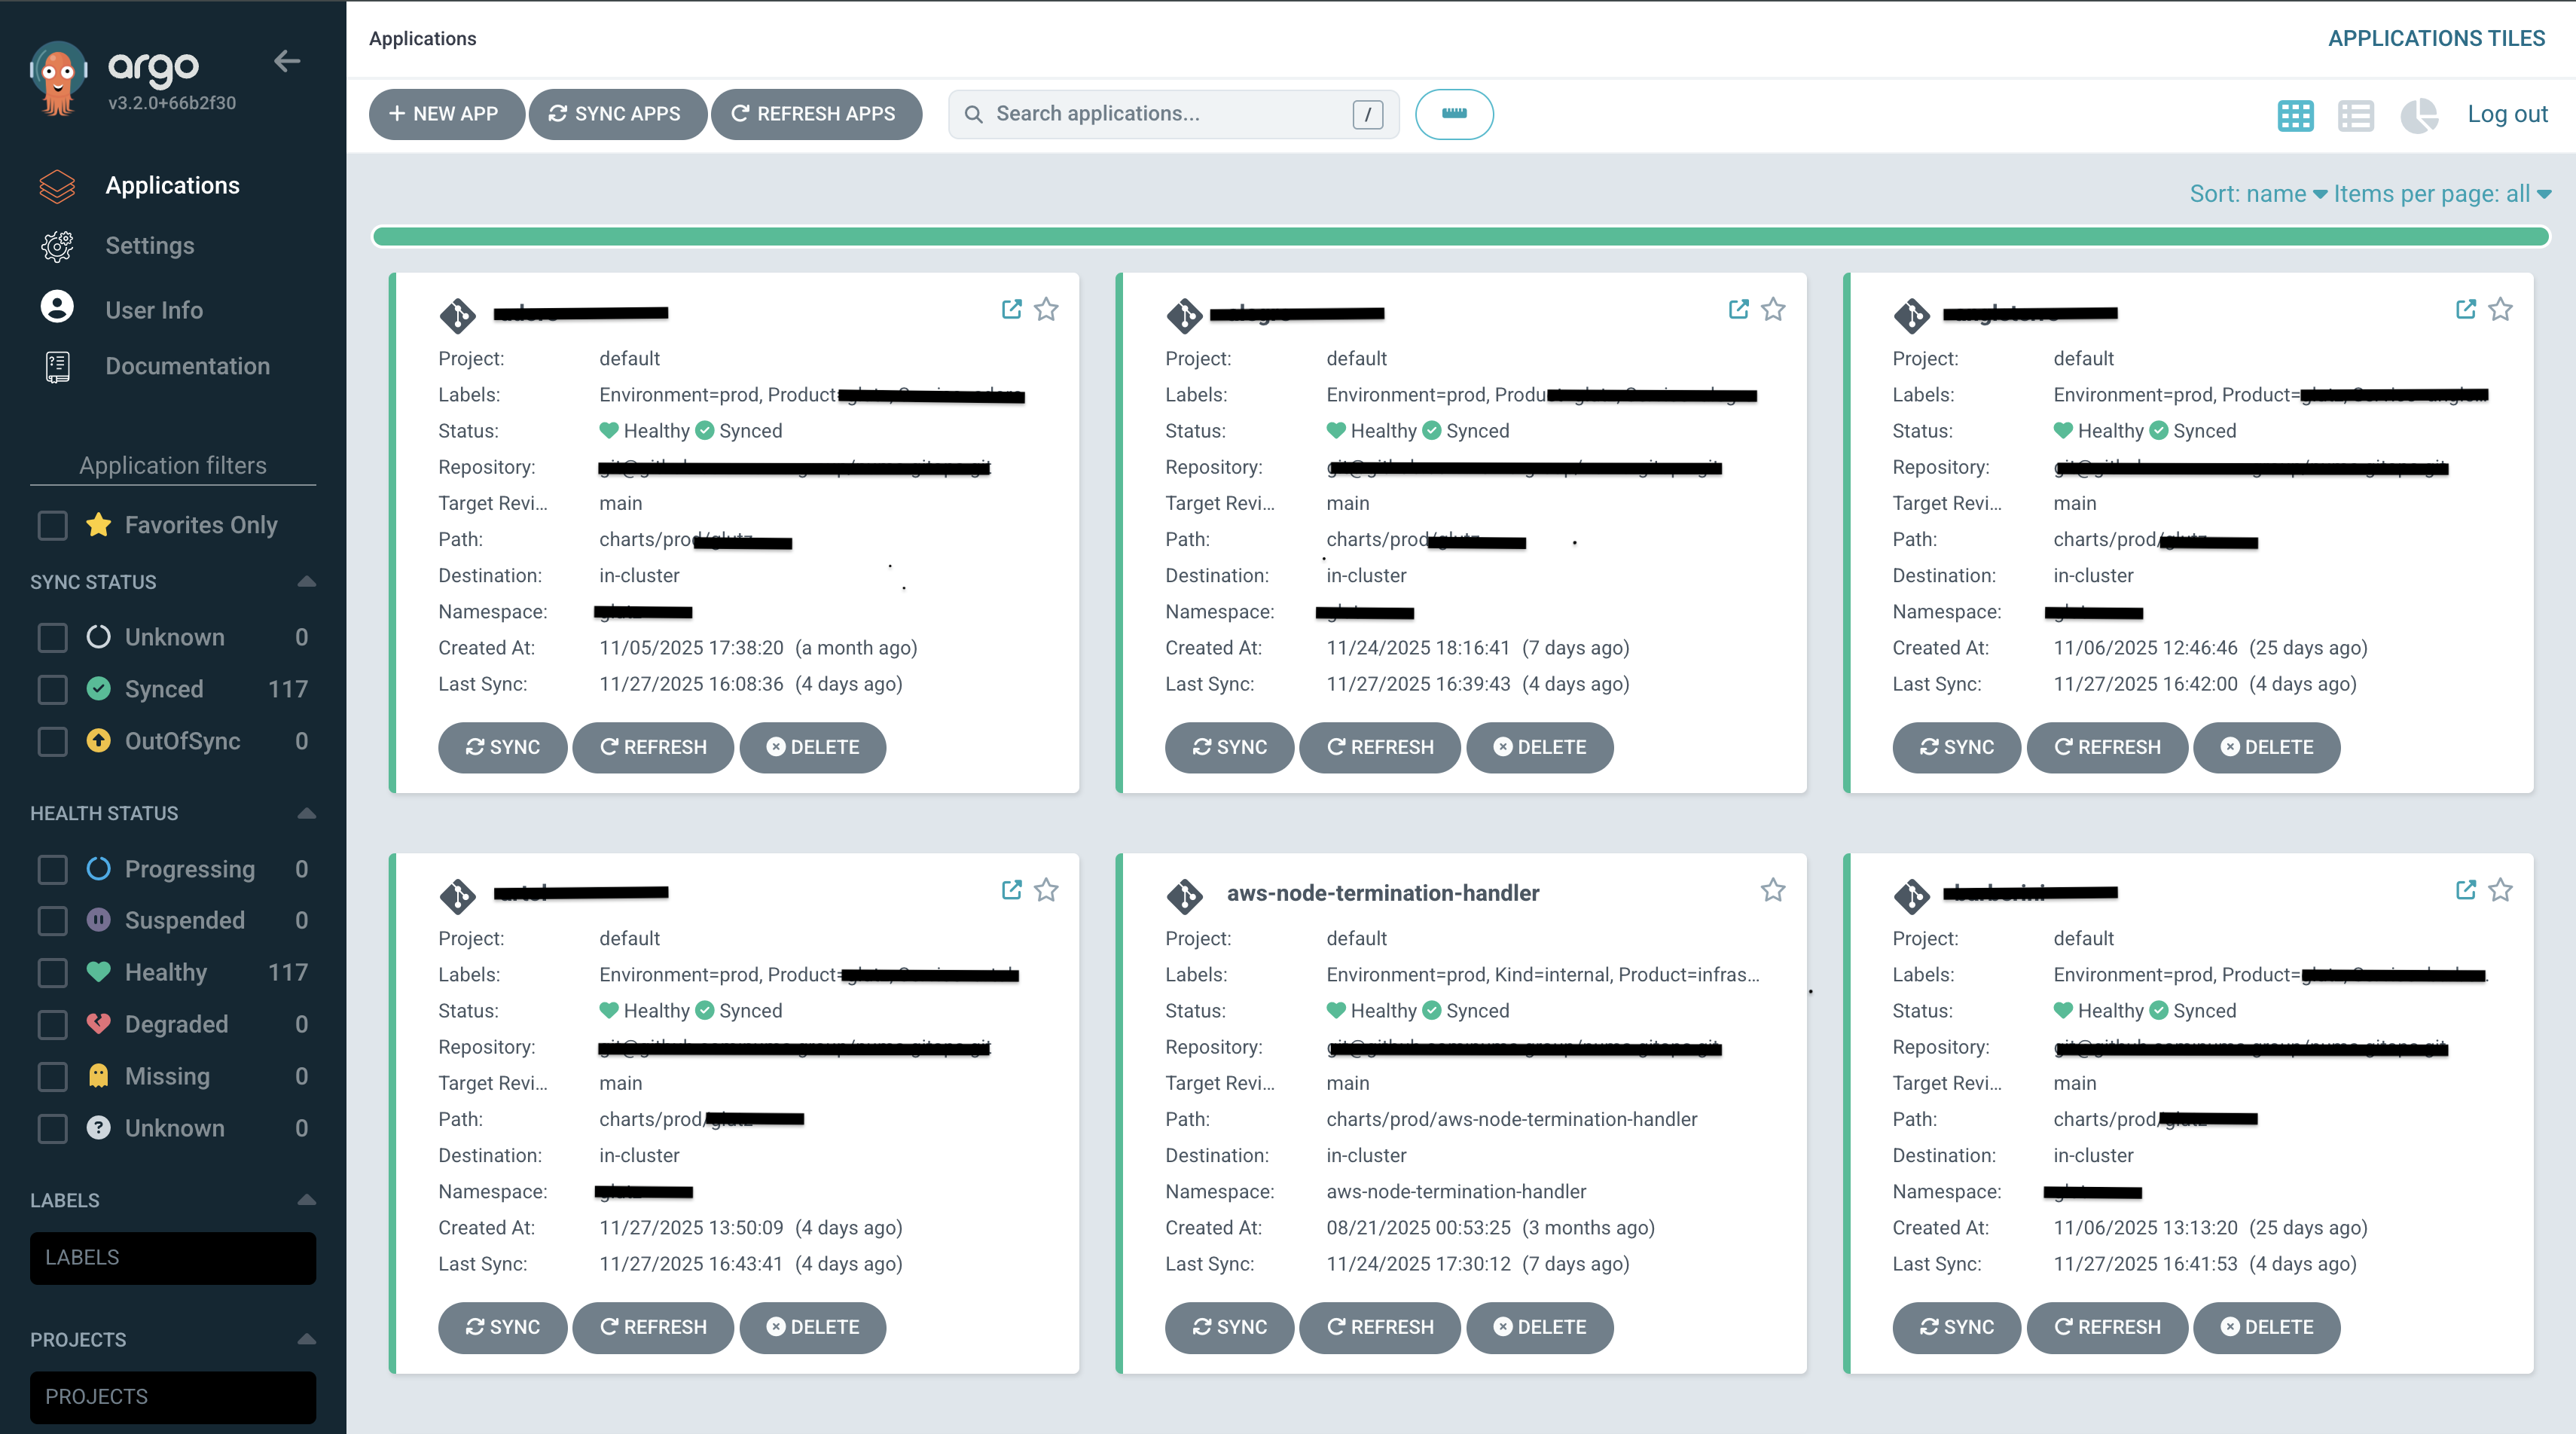
- ArgoCD GitOps DeploymentImplemented GitOps workflow with ArgoCD for continuous deployment:
- Git as Source of Truth: All infrastructure and application configs in Git repositories
- Automated Sync: ArgoCD automatically syncs Git changes to Kubernetes clusters
- Multi-Environment Support: Separate ArgoCD applications for dev, staging, and production
- Health Monitoring: Real-time application health checks and sync status tracking
- Rollback Capability: One-click rollback to previous known-good versions
- Sync Policies: Automated sync with manual approval gates for production
- Deployment AutomationEliminated manual deployment steps through automation:
- Zero-Downtime Deployments: Rolling updates with health checks and readiness probes
- Canary Deployments: Gradual rollout with automatic promotion on success
- Pre-Deployment Checks: Automated validation of configuration, resources, and dependencies
- Post-Deployment Verification: Automated smoke tests and health checks after deployment
- Notification System: Slack notifications for deployment status and failures
The Results
Six months after implementation, the transformation is clear. What was once a firefighting culture has become a proactive engineering organization. The team now spends their time building features instead of fixing outages, and customers experience reliable, consistent service.
Key Achievements
- Zero production incidents - Eliminated weekly outages, achieving 6 months of incident-free operation (down from 4-5 incidents per month). The last production incident was 6 months ago, compared to weekly incidents before.
- 92% alert noise reduction - Reduced from approximately 195 alerts per week (with 180+ being false positives or non-actionable noise) to 15 actionable notifications per week. Engineers now trust alerts because every alert is meaningful and requires action - no more alert fatigue or ignored notifications.
- Deployment time: 45 minutes → 6 minutes - Automated CI/CD pipeline reduced deployment time by 87% while eliminating human error. What used to be a stressful, error-prone process is now a reliable, one-click operation.
- Mean Time to Detection (MTTD): 15 minutes → 2 minutes - Comprehensive monitoring and intelligent alerts catch issues before customers notice. Problems are identified and resolved proactively, not reactively.
- Mean Time to Resolution (MTTR): 45 minutes → 10 minutes - Centralized logging and comprehensive dashboards enable rapid root cause identification and resolution, reducing downtime impact significantly.
- Team productivity up 60% - Engineers no longer spend 40% of time firefighting, enabling focus on feature development. The engineering team has reclaimed 24 hours per week per engineer for productive work.
- 100% deployment success rate - Zero failed deployments in 3 months through automated testing and validation. Every deployment is now predictable and reliable.
- Complete infrastructure visibility - Real-time dashboards for application, database, cache, and infrastructure metrics provide instant insights into system health and performance.
- Proactive issue resolution - Issues are detected and resolved before they impact users, preventing customer-facing incidents. We've prevented 8+ potential outages through proactive monitoring and alerting.
- Redis cache optimization - Improved cache hit rate from 65% to 92%, reducing database load and improving application response times by 40%.
Technical Implementation
For technical teams interested in the implementation details, here's how we built the observability and deployment infrastructure that transformed this organization's reliability.
Monitoring Stack Architecture
Built a comprehensive observability platform that provides complete visibility into application and infrastructure health. The stack is built on industry-standard open-source tools, ensuring maintainability and avoiding vendor lock-in:
- Metrics CollectionPrometheus scrapes metrics from application exporters, Kubernetes, and infrastructure components. Metrics are stored with 15-second granularity and retained for 30 days, enabling detailed analysis and trend identification.
- Visualization & DashboardsGrafana provides real-time visualization with 20+ custom dashboards covering application metrics, database performance, cache statistics, Kubernetes resources, and alert status. Dashboards are organized by service and accessible to the entire engineering team.
- Alert ManagementAlertmanager routes alerts based on severity and service ownership. Critical alerts trigger immediate on-call pages, while warnings are delivered to Slack channels. Alert history and resolution tracking enable continuous improvement of alerting rules.
CI/CD Pipeline Architecture
Implemented a modern GitOps workflow that ensures code quality and enables rapid, reliable deployments:
- GitHub Actions WorkflowCI pipeline triggers on every push and pull request. Workflows run tests, build container images, scan for vulnerabilities, and publish artifacts. All steps run in parallel where possible, with failure at any stage blocking the merge or deployment.
- ArgoCD GitOpsArgoCD continuously monitors Git repositories and automatically syncs application and infrastructure changes to Kubernetes clusters. All 117 applications are managed declaratively through Git, providing audit trails, version control, and easy rollbacks.
- Multi-Environment StrategySeparate ArgoCD applications for development, staging, and production environments. Staging deployments are automatic, while production requires manual approval. Automated promotion workflows enable safe, controlled releases.
Lessons Learned
Key Insights
- Monitoring before alerting: Comprehensive monitoring must be in place before implementing alerts. Without visibility, alerts are just noise.
- Alert quality over quantity: Fewer, well-designed alerts are far more valuable than hundreds of noisy notifications. Every alert should require action.
- Automation eliminates human error: Manual deployments are error-prone. Automated CI/CD pipelines ensure consistency and catch issues before they reach production.
- GitOps enables reliability: Declarative infrastructure management through Git provides auditability, version control, and rapid recovery capabilities.
- Proactive beats reactive: Investing in monitoring and alerting pays dividends by catching issues before they become incidents, saving engineering time and customer trust.
Ready to Eliminate Production Incidents?
Get a free infrastructure audit and discover how much you could save. We'll analyze your setup and provide a detailed optimization roadmap for achieving zero-downtime deployments.